
WASHINGTON — When it comes to living your best life, location matters. Some cities go above and beyond to promote the well-being of their residents, whether it’s by ensuring access to nutritious food, providing ample recreational facilities, or keeping healthcare costs affordable. But in other places, maintaining good health can be an uphill battle. To that point, in its annual list of the healthiest cities in the U.S., WalletHub ranks San Francisco as the clear winner — a choice sure to stir some debate considering some of the far-from-healthy problems the city faces.
To uncover the cities that prioritize their residents’ health, WalletHub crunched the numbers on more than 180 of the most populated U.S. cities. They evaluated each city using 41 key indicators of good health, which were grouped into four main categories: Health Care, Food, Fitness, and Green Space. Researchers looked at everything from the cost of a doctor’s visit to how many people are eating their fruits and veggies to the number of physically active adults. The results? A fascinating snapshot of where in America the healthy life is most accessible.
By using such a diverse array of indicators and assigning them weights based on their relative importance, WalletHub aimed to create a comprehensive and balanced ranking of the healthiest cities in America. However, it’s important to note that no ranking system is perfect, and individual health outcomes can vary widely even within cities that rank highly on these metrics. Nonetheless, this study provides a useful starting point for understanding which urban environments are most conducive to leading a healthy lifestyle.
That’s why San Fran lands atop the others. Despite being mired in a homelessness and drug overdose crisis, the weighted list is based on health factors most easily available to citizens, along with the number of individuals who take advantage of them in each city. San Francisco, though 76th overall in health care ranking, was number one both in healthy food and green space availability. It also ranked 28th overall in fitness.
Similarly, Honolulu placed second overall in green spaces and fourth overall in food, while ranking 27th in fitness and 99th in healthcare. Seattle seemed a bit more balanced than San Francisco and Honolulu, placing fifth overall in fitness, 10th in food, 11th in green space, and 28th in healthcare.
WalletHub’s Healthiest Places to Live in the U.S.
| Overall Rank | City | Total Score | Health Care Rank | Food Rank | Fitness Rank | Green Space Rank |
|---|---|---|---|---|---|---|
| 1 | San Francisco, CA | 67.60 | 76 | 1 | 28 | 1 |
| 2 | Honolulu, HI | 64.28 | 99 | 4 | 27 | 2 |
| 3 | Seattle, WA | 63.68 | 28 | 10 | 5 | 11 |
| 4 | San Diego, CA | 63.08 | 81 | 5 | 13 | 6 |
| 5 | Washington, DC | 63.04 | 39 | 7 | 25 | 9 |
| 6 | Portland, OR | 62.65 | 47 | 6 | 31 | 8 |
| 7 | Denver, CO | 61.99 | 29 | 11 | 19 | 16 |
| 8 | Salt Lake City, UT | 61.18 | 42 | 18 | 17 | 3 |
| 9 | Scottsdale, AZ | 60.32 | 19 | 65 | 1 | 13 |
| 10 | Irvine, CA | 60.29 | 12 | 30 | 10 | 17 |
| 11 | Los Angeles, CA | 59.61 | 101 | 3 | 41 | 20 |
| 12 | Minneapolis, MN | 59.47 | 14 | 32 | 42 | 10 |
| 13 | Austin, TX | 59.43 | 22 | 25 | 6 | 23 |
| 14 | Huntington Beach, CA | 59.40 | 24 | 33 | 2 | 35 |
| 15 | South Burlington, VT | 58.52 | 2 | 17 | 83 | 65 |
| 16 | Boston, MA | 58.41 | 8 | 12 | 48 | 48 |
| 17 | Madison, WI | 58.39 | 15 | 39 | 8 | 29 |
| 18 | New York, NY | 58.12 | 86 | 2 | 117 | 18 |
| 19 | Pittsburgh, PA | 57.76 | 11 | 20 | 43 | 31 |
| 20 | Glendale, CA | 57.17 | 53 | 40 | 15 | 12 |
| 21 | Atlanta, GA | 57.01 | 105 | 19 | 4 | 36 |
| 22 | San Jose, CA | 56.60 | 44 | 13 | 75 | 39 |
| 23 | Orlando, FL | 56.36 | 61 | 22 | 9 | 49 |
| 24 | Fremont, CA | 56.34 | 40 | 26 | 16 | 54 |
| 25 | Portland, ME | 55.70 | 32 | 16 | 137 | 4 |
| 26 | Oakland, CA | 55.36 | 98 | 8 | 64 | 57 |
| 27 | Tampa, FL | 55.26 | 70 | 28 | 18 | 58 |
| 28 | Las Vegas, NV | 55.23 | 155 | 27 | 12 | 25 |
| 29 | Burlington, VT | 54.83 | 4 | 42 | 86 | 41 |
| 30 | Garden Grove, CA | 54.79 | 73 | 37 | 74 | 5 |
| 31 | Raleigh, NC | 54.34 | 17 | 41 | 3 | 124 |
| 32 | Long Beach, CA | 54.29 | 62 | 21 | 34 | 63 |
| 33 | Missoula, MT | 54.24 | 13 | 99 | 44 | 21 |
| 34 | Chicago, IL | 54.23 | 107 | 14 | 62 | 45 |
| 35 | Sacramento, CA | 54.06 | 135 | 15 | 63 | 33 |
| 36 | St. Louis, MO | 53.46 | 139 | 38 | 11 | 47 |
| 37 | Boise, ID | 53.40 | 25 | 110 | 35 | 19 |
| 38 | Overland Park, KS | 53.11 | 1 | 106 | 45 | 90 |
| 39 | Cincinnati, OH | 53.06 | 113 | 56 | 26 | 27 |
| 40 | Miami, FL | 53.05 | 96 | 9 | 89 | 77 |
| 41 | St. Paul, MN | 53.01 | 41 | 79 | 53 | 26 |
| 42 | Grand Rapids, MI | 52.96 | 27 | 52 | 61 | 44 |
| 43 | Rochester, NY | 52.69 | 78 | 29 | 116 | 15 |
| 44 | Phoenix, AZ | 52.65 | 92 | 34 | 47 | 51 |
| 45 | Oceanside, CA | 52.24 | 80 | 58 | 7 | 94 |
| 46 | Richmond, VA | 52.13 | 36 | 54 | 23 | 95 |
| 47 | Tempe, AZ | 52.12 | 60 | 78 | 39 | 32 |
| 48 | Philadelphia, PA | 52.04 | 120 | 23 | 66 | 52 |
| 49 | Fort Lauderdale, FL | 51.97 | 56 | 44 | 77 | 50 |
| 50 | Columbia, MD | 51.78 | 6 | 69 | 71 | 91 |
| 51 | Santa Clarita, CA | 51.72 | 20 | 48 | 90 | 56 |
| 52 | Anaheim, CA | 51.37 | 64 | 35 | 51 | 82 |
| 53 | Virginia Beach, VA | 51.36 | 3 | 74 | 46 | 99 |
| 54 | Plano, TX | 50.98 | 26 | 97 | 14 | 84 |
| 55 | Bismarck, ND | 50.92 | 35 | 100 | 30 | 100 |
| 56 | Louisville, KY | 50.79 | 65 | 66 | 82 | 42 |
| 57 | Vancouver, WA | 50.66 | 88 | 72 | 20 | 87 |
| 58 | Billings, MT | 50.32 | 63 | 43 | 68 | 121 |
| 59 | Pembroke Pines, FL | 50.27 | 43 | 90 | 67 | 38 |
| 60 | Sioux Falls, SD | 50.08 | 7 | 89 | 78 | 112 |
| 61 | Yonkers, NY | 49.90 | 37 | 36 | 150 | 43 |
| 62 | Santa Rosa, CA | 49.88 | 97 | 55 | 72 | 59 |
| 63 | St. Petersburg, FL | 49.75 | 94 | 57 | 54 | 67 |
| 64 | Albuquerque, NM | 49.59 | 140 | 64 | 104 | 24 |
| 65 | Buffalo, NY | 49.47 | 66 | 47 | 99 | 69 |
| 66 | Colorado Springs, CO | 49.33 | 82 | 88 | 33 | 74 |
| 67 | Charlotte, NC | 49.19 | 48 | 49 | 21 | 151 |
| 68 | Nashua, NH | 49.17 | 23 | 105 | 38 | 137 |
| 69 | Tacoma, WA | 48.99 | 112 | 73 | 29 | 104 |
| 70 | Providence, RI | 48.78 | 59 | 83 | 119 | 28 |
| 71 | Lincoln, NE | 48.72 | 5 | 127 | 70 | 80 |
| 72 | Spokane, WA | 48.71 | 71 | 71 | 59 | 98 |
| 73 | Bridgeport, CT | 48.55 | 55 | 114 | 120 | 7 |
| 74 | Juneau, AK | 48.55 | 149 | 76 | 148 | 13 |
| 75 | Jersey City, NJ | 48.48 | 67 | 31 | 115 | 108 |
| 76 | Manchester, NH | 48.47 | 31 | 117 | 60 | 93 |
| 77 | Charleston, SC | 48.41 | 9 | 113 | 73 | 126 |
| 78 | Aurora, CO | 48.28 | 30 | 46 | 92 | 127 |
| 79 | Pearl City, HI | 48.04 | 95 | 59 | 110 | 73 |
| 80 | Tucson, AZ | 47.69 | 126 | 61 | 88 | 70 |
| 81 | Milwaukee, WI | 47.58 | 104 | 81 | 105 | 61 |
| 82 | Omaha, NE | 47.51 | 10 | 107 | 65 | 128 |
| 83 | Jacksonville, FL | 47.38 | 119 | 87 | 52 | 78 |
| 84 | Nashville, TN | 47.33 | 132 | 51 | 98 | 72 |
| 85 | West Valley City, UT | 47.27 | 128 | 70 | 111 | 55 |
| 86 | Salem, OR | 47.17 | 50 | 80 | 121 | 76 |
| 87 | Reno, NV | 47.12 | 137 | 75 | 96 | 64 |
| 88 | Fargo, ND | 47.08 | 33 | 101 | 108 | 105 |
| 89 | Worcester, MA | 47.08 | 51 | 104 | 85 | 88 |
| 90 | Santa Ana, CA | 46.86 | 125 | 45 | 113 | 92 |
| 91 | Baltimore, MD | 46.74 | 143 | 24 | 130 | 96 |
| 92 | Houston, TX | 46.66 | 106 | 63 | 32 | 141 |
| 93 | Chula Vista, CA | 46.60 | 85 | 67 | 57 | 135 |
| 94 | Dallas, TX | 46.51 | 122 | 86 | 37 | 111 |
| 95 | Chandler, AZ | 46.39 | 46 | 96 | 22 | 152 |
| 96 | Durham, NC | 46.17 | 21 | 50 | 87 | 168 |
| 97 | Cedar Rapids, IA | 46.08 | 18 | 149 | 69 | 115 |
| 98 | Warwick, RI | 45.95 | 34 | 92 | 128 | 122 |
| 99 | Oxnard, CA | 45.91 | 123 | 68 | 134 | 53 |
| 100 | New Orleans, LA | 45.58 | 169 | 123 | 97 | 34 |
| 101 | Chesapeake, VA | 45.54 | 16 | 119 | 129 | 89 |
| 102 | Lexington-Fayette, KY | 45.38 | 49 | 77 | 118 | 134 |
| 103 | Modesto, CA | 45.27 | 151 | 98 | 95 | 68 |
| 104 | San Antonio, TX | 45.21 | 160 | 112 | 40 | 83 |
| 105 | New Haven, CT | 45.18 | 87 | 93 | 159 | 30 |
| 106 | Mesa, AZ | 44.99 | 102 | 95 | 55 | 130 |
| 107 | Riverside, CA | 44.90 | 148 | 91 | 49 | 106 |
| 108 | Henderson, NV | 44.90 | 127 | 136 | 100 | 62 |
| 109 | Fort Worth, TX | 44.74 | 69 | 125 | 36 | 143 |
| 110 | Columbus, OH | 44.73 | 83 | 84 | 106 | 131 |
| 111 | Springfield, MO | 44.71 | 114 | 147 | 76 | 75 |
| 112 | Aurora, IL | 44.14 | 91 | 109 | 152 | 22 |
| 113 | Wilmington, DE | 44.12 | 52 | 85 | 178 | 40 |
| 114 | Kansas City, MO | 43.94 | 77 | 121 | 101 | 113 |
| 115 | Rancho Cucamonga, CA | 43.92 | 115 | 138 | 58 | 101 |
| 116 | Nampa, ID | 43.87 | 124 | 139 | 50 | 117 |
| 117 | Glendale, AZ | 43.84 | 117 | 111 | 84 | 107 |
| 118 | Anchorage, AK | 43.75 | 165 | 102 | 157 | 37 |
| 119 | Peoria, AZ | 43.68 | 72 | 120 | 127 | 97 |
| 120 | Des Moines, IA | 43.18 | 58 | 122 | 126 | 118 |
| 121 | Gilbert, AZ | 43.18 | 75 | 103 | 24 | 178 |
| 122 | Columbia, SC | 43.18 | 45 | 143 | 81 | 165 |
| 123 | Little Rock, AR | 42.99 | 68 | 148 | 91 | 140 |
| 124 | Indianapolis, IN | 42.93 | 130 | 94 | 79 | 150 |
| 125 | Rapid City, SD | 42.75 | 38 | 126 | 144 | 139 |
| 126 | Cleveland, OH | 42.61 | 116 | 53 | 158 | 120 |
| 127 | Newport News, VA | 42.05 | 74 | 141 | 142 | 81 |
| 128 | Casper, WY | 42.02 | 133 | 151 | 143 | 85 |
| 129 | Knoxville, TN | 41.98 | 136 | 115 | 107 | 147 |
| 130 | Port St. Lucie, FL | 41.80 | 100 | 116 | 114 | 167 |
| 131 | Dover, DE | 41.46 | 90 | 152 | 122 | 161 |
| 132 | Akron, OH | 41.37 | 89 | 160 | 139 | 71 |
| 133 | Tulsa, OK | 41.33 | 103 | 159 | 80 | 136 |
| 134 | Tallahassee, FL | 41.33 | 79 | 165 | 103 | 129 |
| 135 | Lubbock, TX | 40.78 | 129 | 176 | 56 | 132 |
| 136 | Cheyenne, WY | 40.66 | 57 | 171 | 155 | 144 |
| 137 | Ontario, CA | 40.31 | 167 | 133 | 141 | 46 |
| 138 | Norfolk, VA | 40.04 | 54 | 128 | 138 | 154 |
| 139 | Fresno, CA | 40.03 | 161 | 82 | 147 | 142 |
| 140 | Stockton, CA | 39.99 | 172 | 108 | 153 | 86 |
| 141 | Birmingham, AL | 39.87 | 121 | 157 | 112 | 138 |
| 142 | Oklahoma City, OK | 39.83 | 93 | 131 | 136 | 146 |
| 143 | Arlington, TX | 39.57 | 110 | 154 | 93 | 155 |
| 144 | Grand Prairie, TX | 39.54 | 111 | 155 | 165 | 60 |
| 145 | Chattanooga, TN | 39.37 | 131 | 170 | 124 | 66 |
| 146 | Cape Coral, FL | 39.01 | 134 | 153 | 125 | 159 |
| 147 | El Paso, TX | 38.76 | 168 | 124 | 154 | 109 |
| 148 | Irving, TX | 38.75 | 145 | 134 | 94 | 163 |
| 149 | Huntsville, AL | 38.70 | 109 | 167 | 123 | 170 |
| 150 | Newark, NJ | 38.64 | 166 | 62 | 175 | 149 |
| 151 | Moreno Valley, CA | 38.52 | 150 | 129 | 164 | 119 |
| 152 | Hialeah, FL | 38.50 | 142 | 60 | 169 | 162 |
| 153 | Garland, TX | 38.28 | 153 | 145 | 149 | 114 |
| 154 | Bakersfield, CA | 37.88 | 170 | 130 | 151 | 125 |
| 155 | San Bernardino, CA | 37.69 | 177 | 137 | 160 | 79 |
| 156 | Fort Wayne, IN | 37.60 | 147 | 142 | 102 | 171 |
| 157 | Fontana, CA | 37.54 | 163 | 135 | 156 | 123 |
| 158 | Lewiston, ME | 37.52 | 152 | 140 | 171 | 110 |
| 159 | Charleston, WV | 37.06 | 144 | 132 | 146 | 176 |
| 160 | Mobile, AL | 36.88 | 158 | 150 | 132 | 177 |
| 161 | Greensboro, NC | 36.76 | 118 | 144 | 135 | 175 |
| 162 | Wichita, KS | 36.54 | 141 | 169 | 109 | 164 |
| 163 | Baton Rouge, LA | 36.26 | 159 | 173 | 131 | 133 |
| 164 | Toledo, OH | 36.15 | 171 | 163 | 161 | 103 |
| 165 | Las Cruces, NM | 35.67 | 84 | 179 | 174 | 145 |
| 166 | Amarillo, TX | 35.55 | 164 | 164 | 170 | 116 |
| 167 | North Las Vegas, NV | 35.34 | 173 | 158 | 179 | 102 |
| 168 | Montgomery, AL | 34.63 | 157 | 175 | 133 | 181 |
| 169 | Jackson, MS | 34.46 | 138 | 161 | 167 | 169 |
| 170 | Memphis, TN | 34.11 | 178 | 168 | 145 | 148 |
| 171 | Winston-Salem, NC | 33.84 | 108 | 172 | 140 | 182 |
| 172 | Fort Smith, AR | 33.61 | 154 | 156 | 177 | 173 |
| 173 | Huntington, WV | 33.38 | 176 | 146 | 172 | 156 |
| 174 | Detroit, MI | 32.98 | 179 | 118 | 180 | 157 |
| 175 | Corpus Christi, TX | 32.81 | 174 | 162 | 162 | 166 |
| 176 | Fayetteville, NC | 32.78 | 146 | 177 | 166 | 172 |
| 177 | Augusta, GA | 32.71 | 156 | 166 | 173 | 174 |
| 178 | Shreveport, LA | 30.57 | 162 | 181 | 176 | 160 |
| 179 | Columbus, GA | 29.76 | 182 | 174 | 163 | 158 |
| 180 | Laredo, TX | 29.67 | 181 | 180 | 181 | 153 |
| 181 | Gulfport, MS | 29.13 | 175 | 178 | 168 | 180 |
| 182 | Brownsville, TX | 24.36 | 180 | 182 | 182 | 179 |
Note: With the exception of “Total Score,” all of the columns in the table above depict the relative rank of that city, where a rank of 1 represents the best conditions for that metric category.
Standout Cities
Now, just because some cities placed lower on the overall list doesn’t mean they don’t have standout qualities. Here are some interesting points that the researchers discovered in their data.
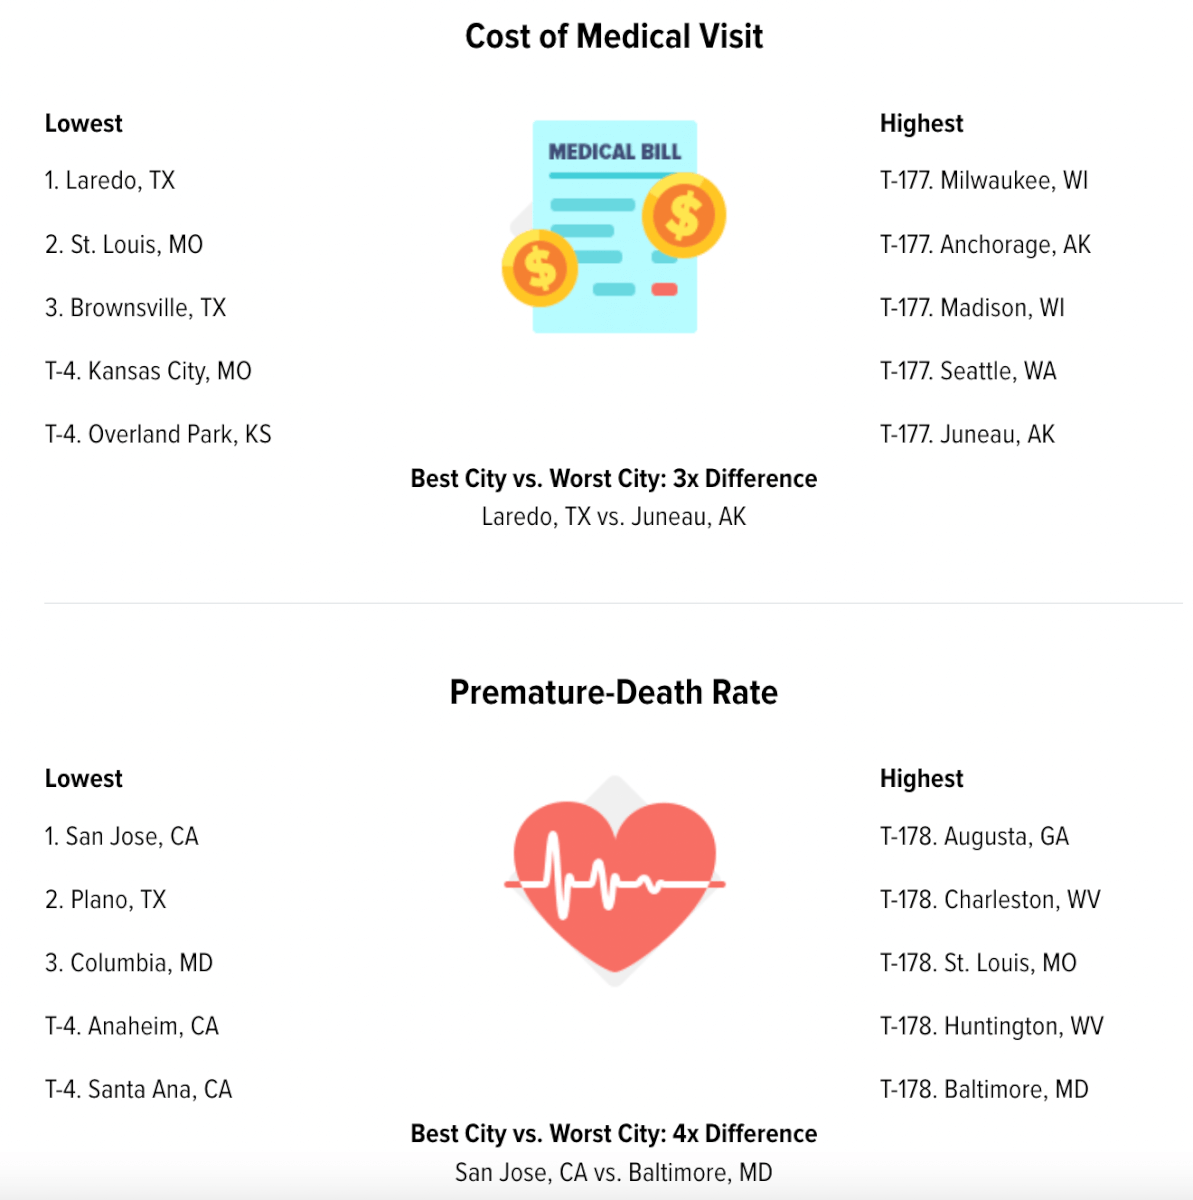
Let’s start with one of the most crucial factors: healthcare affordability. In Laredo, Texas, the cost of a medical visit is three times lower than in Juneau, Alaska. That’s a huge difference that can make or break someone’s ability to get the care they need. St. Louis, Kansas City, and Brownsville, Texas also stood out for their low healthcare costs.
But it’s not just about affordable doctor’s visits – having enough mental health support matters too. If you’re looking for easy access to mental health counselors, Spokane, Washington and Colorado Springs tied as the top places to be, with 12 times more counselors per capita than Laredo, Texas, despite the city’s aforementioned affordability. Rapid City, South Dakota and Richmond, Virginia also scored high in this category.
Of course, preventative care is key to staying healthy, and that starts with what we put on our plates. Portland, Maine takes the cake (or should we say, the carrot?) for the lowest percentage of adults not eating enough fruits and veggies per day. San Francisco, Oakland, and Fremont, California are also crushing it in the healthy eating department. On the flip side, southern cities like Memphis, Chattanooga, and Baton Rouge could use some work in getting their greens.
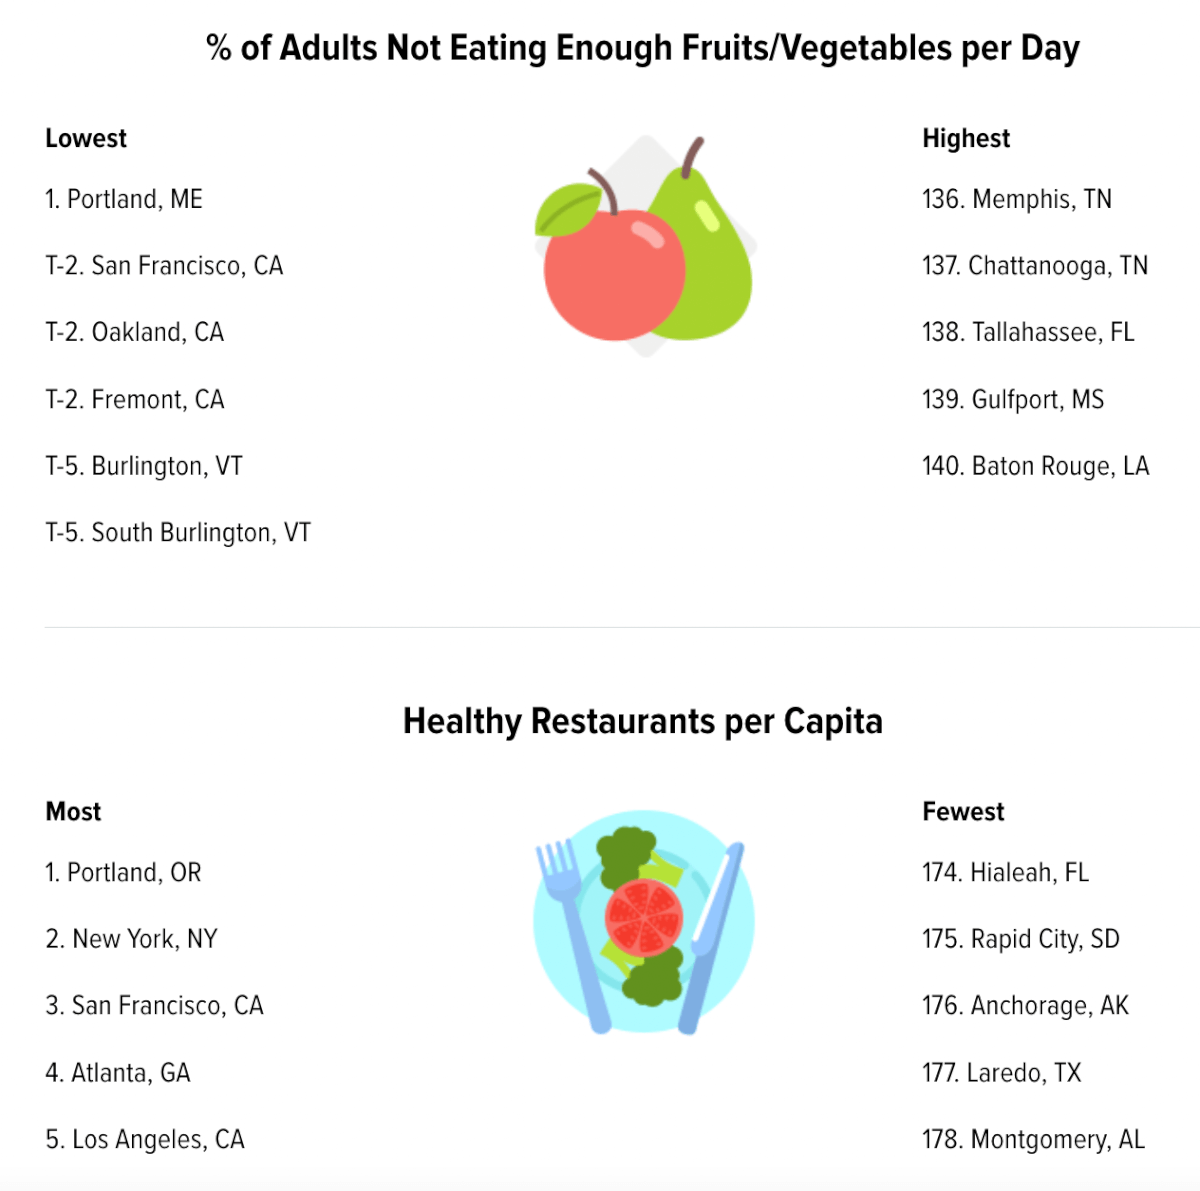
Along with what you eat, where you can eat healthy matters too. Portland, Oregon tops the list for the most healthy restaurants per capita, followed closely by New York City, San Francisco, Atlanta, and Los Angeles. Meanwhile, if you’re looking for a dietitian or nutritionist to help you stay on track, Durham, North Carolina, Lexington-Fayette, Kentucky, Billings, Montana, San Jose, California, and Madison, Wisconsin have the highest number of these professionals per capita.
Staying active is another crucial component of health, and some cities make it easier than others. If you want to break a sweat without breaking the bank, Lubbock, Texas has the lowest average monthly cost of a fitness club membership – nine times lower than in New York City. Glendale, Arizona, Bismarck, North Dakota, Columbus, Georgia, and Montgomery, Alabama also offer budget-friendly fitness options.
But the real superstars of physical activity? Look no further than South Burlington, Vermont, where the percentage of physically active adults is twice as high as in Hialeah, Florida. Irvine, California, Seattle, Washington, Huntington Beach, California, and Scottsdale, Arizona are also filled with folks who know the value of getting their heart rate up.
Still don’t get how the researchers came to their conclusions? Here’s a more in-depth breakdown of WalletHub methodology:
- Each of the 41 indicators was assigned a specific weight based on its perceived importance in promoting overall health and well-being. For example, the premature death rate was given a triple weight, while metrics like the number of farmer’s markets per capita were given a full weight.
- The researchers gathered data for each metric from a variety of reputable sources, including the U.S. Census Bureau, the Bureau of Labor Statistics, County Health Rankings, and the Centers for Disease Control and Prevention, among others.
- Each metric was graded on a 100-point scale, with a score of 100 representing the most favorable conditions for a healthy lifestyle.
- For metrics marked with an asterisk (*), the data was only available at the state level. For metrics marked with two asterisks (**), the researchers calculated the population size using the square root of the population to avoid overcompensating for minor differences across cities.
- After determining each city’s weighted average across all metrics, WalletHub used the resulting scores to rank-order the cities from most to least healthy.
Within each of the four categories, certain indicators were given additional weight:
- In the Health Care dimension, premature death rate was given a triple weight, while other metrics like the cost of a doctor’s visit or the number of mental health counselors per capita were given a full weight.
- Under the Food dimension, inadequate fruit and vegetable consumption was assigned a double weight, while factors like the number of healthy restaurants per capita were given a full weight.
- For Fitness, the share of adults who engage in any physical activity was given a double weight, while metrics like the average cost of a fitness club membership were assigned a full weight.
- In the Green Space category, all indicators – such as acres of parkland per capita, hiking trails per capita, and a city’s “greenness” – were given equal weights.
So what’s the takeaway? Where you call home can have a real impact on how easy it is to live a healthy life. No matter where you hang your hat, however, making your well-being a priority – whether that’s through regular check-ups, loading up on veggies, moving your body, or taking care of your mental health – is always a worthwhile investment. And who knows? Maybe your city will top the charts next year as America’s healthiest hometown.
Needles on the ground as well as poop, urine smell makes me wonder what the criteria was for healthy living!
This list is pure liberal propaganda. Most if not all the top 20 cities in the list are Democrat ran, implying that Conservative ran cities are unhealthy. Give me a break! Poop, drugs and AIDS now make you healthy!?
I’d rather live under an interstate in Tampa than in million dollar brownstone in SFO. What a dump.
BTW….”healthiest” city doesn’t mean best quality of life.