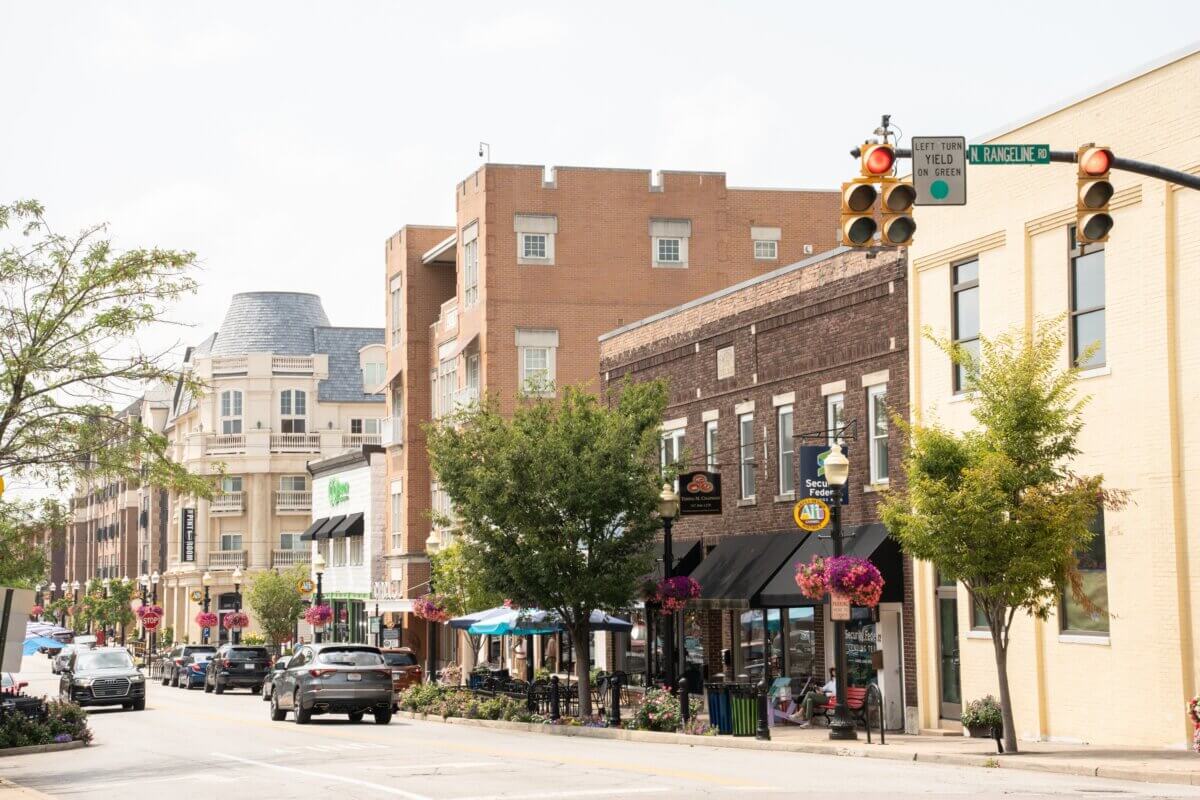
Street scene from Midwest suburban city of Carmel, Indiana. (Credit: Little Vignettes Photo/Shutterstock)
WASHINGTON — In the quest for the ideal place to call home, a new study uncovers a tale of two cities — one thriving and one struggling — at opposite ends of the small-city spectrum.
WalletHub’s latest analysis of over 1,300 U.S. cities with populations between 25,000 and 100,000 has crowned Carmel, Indiana as America’s best small city for 2024, while Isla Vista, California finds itself at the bottom of the list.
The study found that small cities can offer significant financial benefits compared to major metropolitan areas. For example, the cost of living for a two-parent, two-child family in a small New York town can be as low as around $7,000 per month, while the cost for the same family in Manhattan is nearly twice as much at $13,300.
“Not everyone craves the bright lights and crowded spaces of big cities,” says Adam McCann, a WalletHub financial writer, in a statement. “In fact, almost one-third of Americans (31%) say they would prefer to live in the suburbs, compared to 16% for urban areas and 24% for rural communities.”
Carmel, a suburb of Indianapolis, stands out with its robust economy, boasting a mere 3% unemployment rate and an average annual household income of nearly $133,000. The city’s residents enjoy excellent credit scores, with a median of 775 (18th-highest in the country). Carmel also shines in health and safety metrics, with the fourth-lowest share of adults in fair or poor health and the 23rd-lowest premature death rate. Safety-wise, it has the fourth-lowest pedestrian fatality rate and the 75th-lowest violent crime rate.
After Carmel, the study says Brookfield, Wisconsin is America’s second best small city. Brookfield matches Carmel’s low 3% unemployment rate and has the 10th-lowest poverty rate, with only 3% of its population living below the poverty line. The city boasts the 96th-highest homeownership rate in the country and the 11th-best median credit score at 782.
Health indicators are strong in Brookfield, with the 5th-lowest share of residents in fair or poor health and over 98% of the population having health insurance (11th-highest percentage nationwide). The city also has the 16th-lowest percentage of adults with no leisure time, a factor beneficial for mental health.
Lexington, Massachusetts follows Brookfield on the list. The city impresses with its safety record, boasting the fourth-lowest property crime rate and 37th-lowest violent crime rate among the studied cities. It also has the 21st-fewest car crash deaths and 17th-fewest drunk driving fatalities per capita. Economically, Lexington shines with one of the highest median annual household incomes in the country at over $206,000. Residents also have the 10th-highest median credit score at 783. The city benefits from being in Massachusetts, the state with the best school systems in the country according to WalletHub’s rankings.
In stark contrast, Isla Vista, home to a large student population near the University of California, Santa Barbara, faces challenges across multiple categories, particularly in economic health and safety.
Calculating America’s Best Small Cities
To determine the rankings, WalletHub compared 1,318 cities across five key dimensions: 1) Affordability, 2) Economic Health, 3) Education & Health, 4) Quality of Life and 5) Safety. These dimensions were evaluated using 45 relevant metrics, each graded on a 100-point scale, with 100 representing the most favorable conditions for small-city residents.
The study only considered cities with populations between 25,000 and 100,000 and focused on the “city proper” in each case, excluding surrounding metro areas. Data was collected from sources including the U.S. Census Bureau, Bureau of Labor Statistics, FBI, County Health Rankings, and WalletHub’s own research.
Top 50 Best Small Cities in America for 2024:
- Carmel, IN
- Brookfield, WI
- Lexington, MA
- Fishers, IN
- Appleton, WI
- Apex, NC
- Brentwood, TN
- Lancaster, PA
- Bozeman, MT
- Westfield, IN
- Milton, MA
- Fair Lawn, NJ
- Leesburg, VA
- Noblesville, IN
- Castle Rock, CO
- Kaysville, UT
- Saratoga Springs, NY
- Downers Grove, IL
- Needham, MA
- Arlington, MA
- Zionsville, IN
- Portland, ME
- Franklin, TN
- Ridgewood, NJ
- Lehi, UT
- Leawood, KS
- Syracuse, UT
- Holland, MI
- Princeton, NJ
- Newton, MA
- Melrose, MA
- Algonquin, IL
- Woodstock, GA
- Wake Forest, NC
- Glen Ellyn, IL
- Rockwall, TX
- Belmont, MA
- Woodbury, MN
- Leander, TX
- Brownsburg, IN
- Mason, OH
- Los Altos, CA
- Duluth, GA
- Menomonee Falls, WI
- Broomfield, CO
- Stratford, CT
- Palo Alto, CA
- Sammamish, WA
- Waukesha, WI
- Bentonville, AR
Bottom 50 Small Cities in America for 2024:
- Marrero, LA
- Atlantic City, NJ
- Albany, GA
- Gary, IN
- Florence, SC
- Texarkana, AR
- North Little Rock, AR
- Camden, NJ
- Jacksonville, AR
- Petersburg, VA
- Pine Bluff, AR
- Alexandria, LA
- Greenville, MS
- Monroe, LA
- West Memphis, AR
- Wasco, CA
- Bessemer, AL
- Isla Vista, CA
- Stonecrest, GA
- Central, LA
- Huntington Park, CA
- Port Arthur, TX
- Pueblo West, CO
- Fort Hood, TX
- East Point, GA
- Dania Beach, FL
- Delano, CA
- East St. Louis, IL
- LaGrange, GA
- Portsmouth, VA
- Lauderdale Lakes, FL
- Meridian, MS
- Albany, GA
- Gary, IN
- Florence, SC
- Texarkana, AR
- North Little Rock, AR
- Camden, NJ
- Jacksonville, AR
- Petersburg, VA
- Pine Bluff, AR
- Alexandria, LA
- Greenville, MS
- Monroe, LA
- West Memphis, AR
- Wasco, CA
- Bessemer, AL
- Isla Vista, CA
- Lakewood, NJ
- San Luis Obispo, CA
While the study provides valuable insights, it’s important to note that individual preferences and circumstances play a significant role in determining the best place to live. Factors like job opportunities, family considerations, and personal lifestyle preferences should always be taken into account when choosing a new home.
Interactive Map: Where Does Your City Rank?
Choosing the Best Small City
When evaluating small cities, experts recommend considering various factors.
“The best small cities offer strong job markets, high-quality education, good health care, safe living conditions and plenty of local flair to help you achieve a high quality of life,” notes Chip Lupo, a WalletHub analyst.
“The number one indicator to me is whether a city is pro- or anti-growth. A city that is not open to growth is a city that is stagnating or in decline,” adds Bart McLeroy, Professor of Real Estate at Collin College.
McLeroy also suggests looking at school district quality, infrastructure maintenance, and the city’s bond rating as proxies for overall community quality.
“Remember that our housing needs change over time. Are there opportunities to move up to larger or smaller accommodations in the area as your needs change over time?” McLeroy advises.
Study Methodology
To determine the rankings, WalletHub compared 1,318 cities across five key dimensions:
- Affordability (20 total points)
- Economic Health (20 total points)
- Education & Health (20 total points)
- Quality of Life (20 total points)
- Safety (20 total points)
These dimensions were evaluated using 45 relevant metrics, each graded on a 100-point scale with 100 representing the most favorable conditions for small-city residents. Key metrics included:
- Median Household Income
- Cost of Living
- Homeownership Rate
- Housing Costs
- Population Growth
- Income Growth
- Job Growth
- Unemployment Rate
- School-System Quality
- Share of Insured Population
- Premature-Death Rate
- Average Commute Time
- Number of Attractions
- Violent-Crime Rate
- Property-Crime Rate
Data was collected from sources including the U.S. Census Bureau, Bureau of Labor Statistics, FBI, County Health Rankings, and WalletHub’s own research.
Limitations and Considerations
While this study provides valuable insights, it’s important to note several limitations:
- The study only considered cities with populations between 25,000 and 100,000, excluding smaller towns and larger cities that may offer similar benefits.
- The “city proper” was used for each location, which may not reflect the broader metropolitan area’s characteristics.
- Some data was only available at the state level, which may not accurately represent conditions in specific cities.
- The weighting of different factors is subjective and may not align with individual priorities.
- The study uses the most recent data available, but some information may not reflect current conditions, especially given rapid changes in some areas due to the COVID-19 pandemic and economic fluctuations.
- Quality of life factors are inherently subjective and may vary greatly based on personal preferences and lifestyle.
Readers should use this study as a starting point for research rather than a definitive guide. Personal circumstances, job opportunities, and individual preferences should always be the primary factors in choosing a place to live.


Uh? Gary, IN, is number 1272 and 1302???
I’m unimpressed. Toss the entire study.
Gary, IN is listed twice.