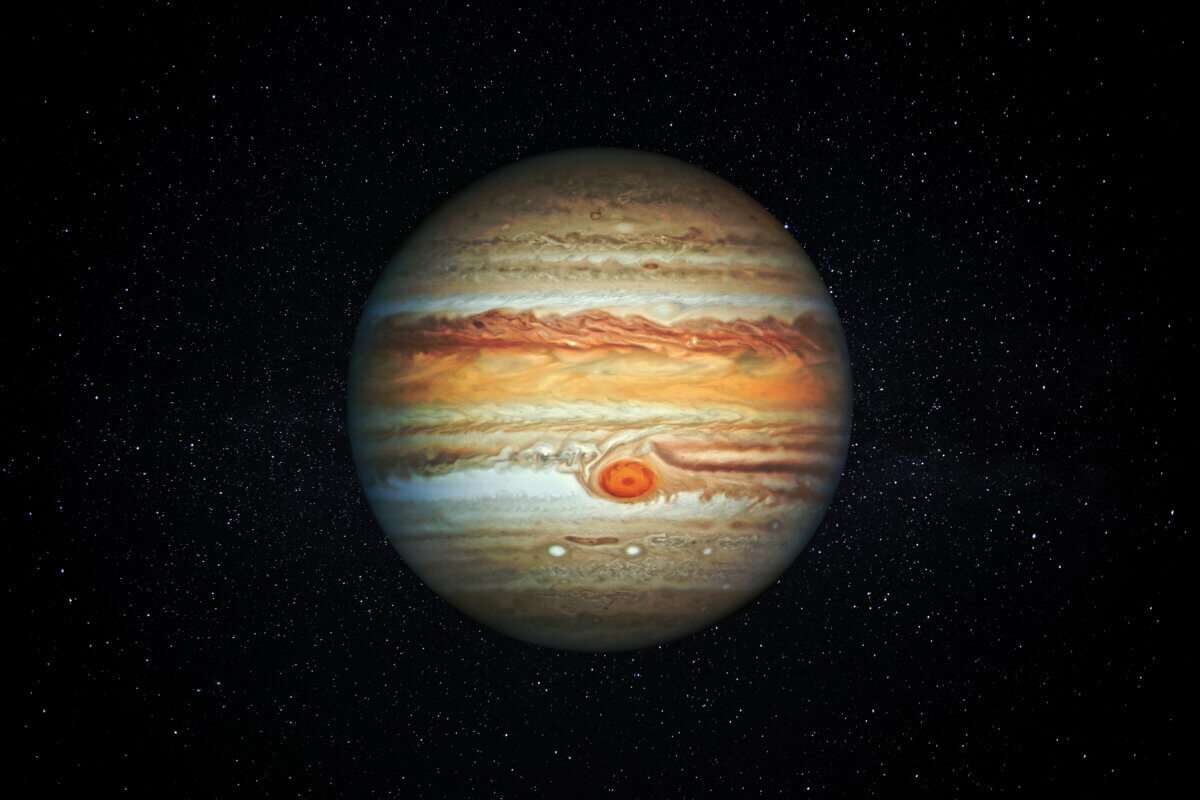
In regular imaging, Jupiter's dark ovals cannot be detected. (24K-Production/Shutterstock)
GREENBELT, Md. — Jupiter’s Great Red Spot, a colossal storm that has raged for centuries, is revealing new secrets about its dynamic nature. Recent observations using NASA’s Hubble Space Telescope have uncovered an unexpected behavior in this iconic feature of our solar system’s largest planet. Scientists have discovered that the Great Red Spot undergoes a rhythmic 90-day cycle of changes, offering fresh insights into the complex behavior of planetary atmospheres.
Visible from Earth as a massive red oval on Jupiter’s surface, The Great Red Spot (GRS) is an anticyclonic storm – a high-pressure system rotating counter to the planet’s spin. This celestial giant has captivated astronomers and the public alike for hundreds of years, with its size dwarfing that of Earth. However, recent observations have shown that the spot has been shrinking, prompting scientists to take a closer look at its behavior.
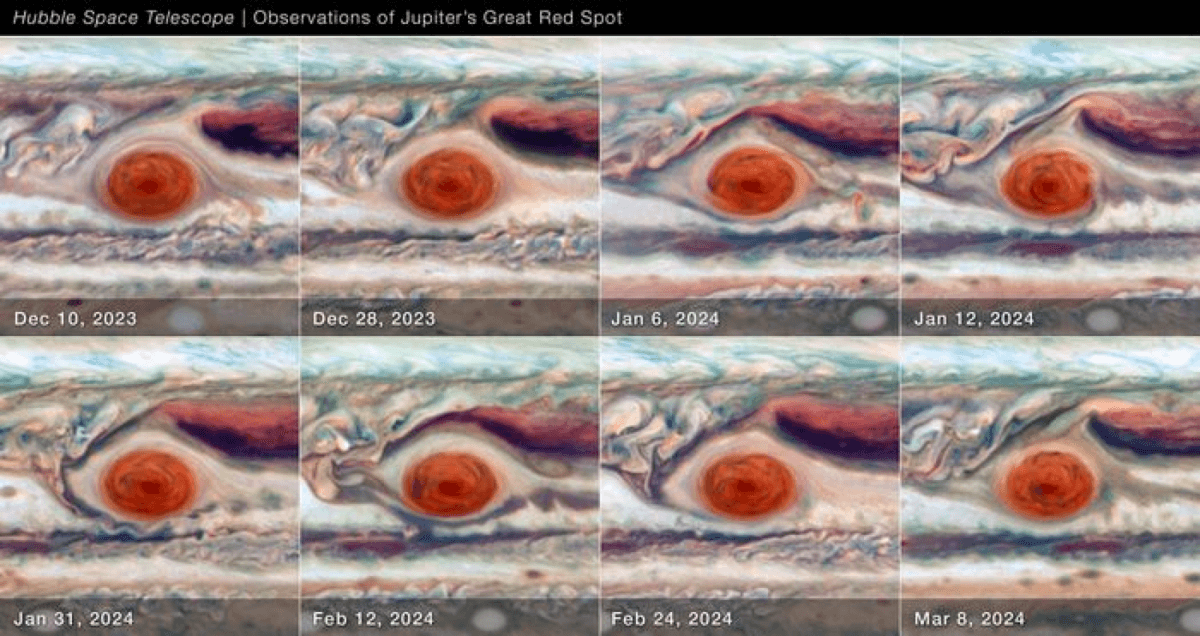
This discovery, published in The Planetary Science Journal, challenges previous assumptions about the stability of the Great Red Spot. Over a period of 90 days between December 2023 and March 2024, Hubble captured high-resolution images of the storm, allowing scientists to create a time-lapse movie of its behavior. The results show the Great Red Spot “jiggling like a bowl of gelatin,” as described by NASA.
“While we knew its motion varies slightly in its longitude, we didn’t expect to see the size oscillate. As far as we know, it’s not been identified before,” says the study’s lead author, Amy Simon of NASA’s Goddard Space Flight Center, in a statement.
This oscillation in size coincides with changes in the storm’s drift rate and brightness, creating a complex pattern of behavior that was previously undetected.
The study utilized Hubble’s advanced imaging capabilities to measure various aspects of the Great Red Spot, including its position, size, shape, and wind speeds. The researchers found that when the storm is at its slowest drift, it reaches its maximum width and becomes brighter in ultraviolet light. This pattern repeats every 90 days, creating a cosmic dance of expansion and contraction.
One of the most intriguing aspects of this discovery is the correlation between the storm’s size and its core brightness. The distinct core of the Great Red Spot becomes brightest when the storm is at its largest size in its oscillation cycle. This change in brightness indicates less haze absorption in the upper atmosphere, providing clues about the storm’s internal structure and composition.
The team also examined the storm’s wind patterns using advanced image analysis techniques. They found that the maximum wind speeds within the Great Red Spot vary by about 20 meters per second (45 miles per hour) over the course of the oscillation cycle. While this variation is relatively small compared to the storm’s overall wind speeds, which can exceed 400 kilometers per hour (250 miles per hour), it provides valuable information about the storm’s internal dynamics.
“As it accelerates and decelerates, the GRS is pushing against the windy jet streams to the north and south of it. It’s similar to a sandwich where the slices of bread are forced to bulge out when there’s too much filling in the middle,” explains co-author Mike Wong of the University of California at Berkeley. “This interaction between the storm and Jupiter’s powerful wind bands may play a crucial role in maintaining the Great Red Spot’s longevity and stability.”
One surprising aspect of the study is that the Great Red Spot does not appear to follow a previously established relationship between its shape and internal rotation, known as the Kida relation. This finding suggests that the storm’s structure and behavior are more complex than previously thought, possibly due to its three-dimensional nature and interactions with Jupiter’s deeper atmosphere.
The discovery of this 90-day cycle raises new questions about the forces driving the Great Red Spot’s behavior. While the exact cause of the oscillation remains unknown, the researchers speculate that it could be related to interactions between the storm and its surrounding atmosphere or possibly to waves propagating through Jupiter’s complex atmospheric layers.
By studying the Great Red Spot’s rhythmic changes, scientists hope to gain insights into the processes that shape and maintain long-lived storms on other planets, both in our solar system and beyond. Understanding the mechanisms of the largest storms in the solar system puts the theory of hurricanes on Earth into a broader cosmic context, which might be applied to better understanding the meteorology on planets around other stars.
Paper Summary
Methodology
The study utilized the Hubble Space Telescope to capture high-resolution images of Jupiter’s Great Red Spot over a 90-day period. Eight observation dates were selected to cover a complete oscillation cycle. The researchers used various filters to examine different aspects of the storm, including its visible appearance, ultraviolet brightness, and methane absorption. They employed image processing techniques to measure the storm’s size, shape, position, and wind speeds. Advanced algorithms were used to analyze cloud movements and calculate wind velocities within and around the Great Red Spot.
Key Results
The study found that the Great Red Spot undergoes a 90-day oscillation in several key characteristics. Its longitudinal drift rate, width, and ultraviolet brightness all vary in a coordinated manner. The storm’s size is largest and its core is brightest in ultraviolet light when it is drifting at its slowest rate. Wind speeds within the storm were found to vary by about 20 meters per second over the cycle. The research also revealed that the storm’s behavior does not conform to the previously established Kida relation, which describes the relationship between a vortex’s shape and its internal rotation.
Study Limitations
The study was limited to observations over a single 90-day cycle, which may not capture longer-term variations or anomalies in the Great Red Spot’s behavior. Some planned observations were affected by telescope operational constraints, resulting in incomplete data for certain dates. The resolution of wind velocity measurements was limited by the time separation between images, leading to larger uncertainties in some velocity calculations.
Discussion & Takeaways
The discovery of the 90-day oscillation cycle provides new insights into the dynamic nature of Jupiter’s Great Red Spot. The coordinated changes in size, brightness, and drift rate suggest complex interactions between the storm and its surrounding atmosphere. The study highlights the need for further research to understand the underlying mechanisms driving these oscillations and their implications for atmospheric dynamics on gas giant planets. The findings also demonstrate the value of high-frequency, high-resolution observations in studying planetary atmospheres.
Funding & Disclosures
The study was supported by grants associated with Hubble Space Telescope programs GO16995, GO17275, and GO17294. The researchers acknowledged the support of Hubble schedulers and program coordinators in enabling the high-cadence data set used in the study. The Hubble data used in the analyses are publicly available through the MAST archive. The results were presented at the 56th annual meeting of the American Astronomical Society Division for Planetary Sciences in Boise, Idaho.


