(Photo by Roberto Lee Cortes from Pexels)
NEW YORK — New York City has a reputation of being a gritty and grey urban metropolis. However, the five boroughs actually feature a whole lot of greenery. Fascinating new research by a team at Columbia University’s Climate School finds that on sunny summer days, photosynthesis by local trees and green spaces absorbs all the carbon emissions produced by surrounding cars, trucks, and buses!
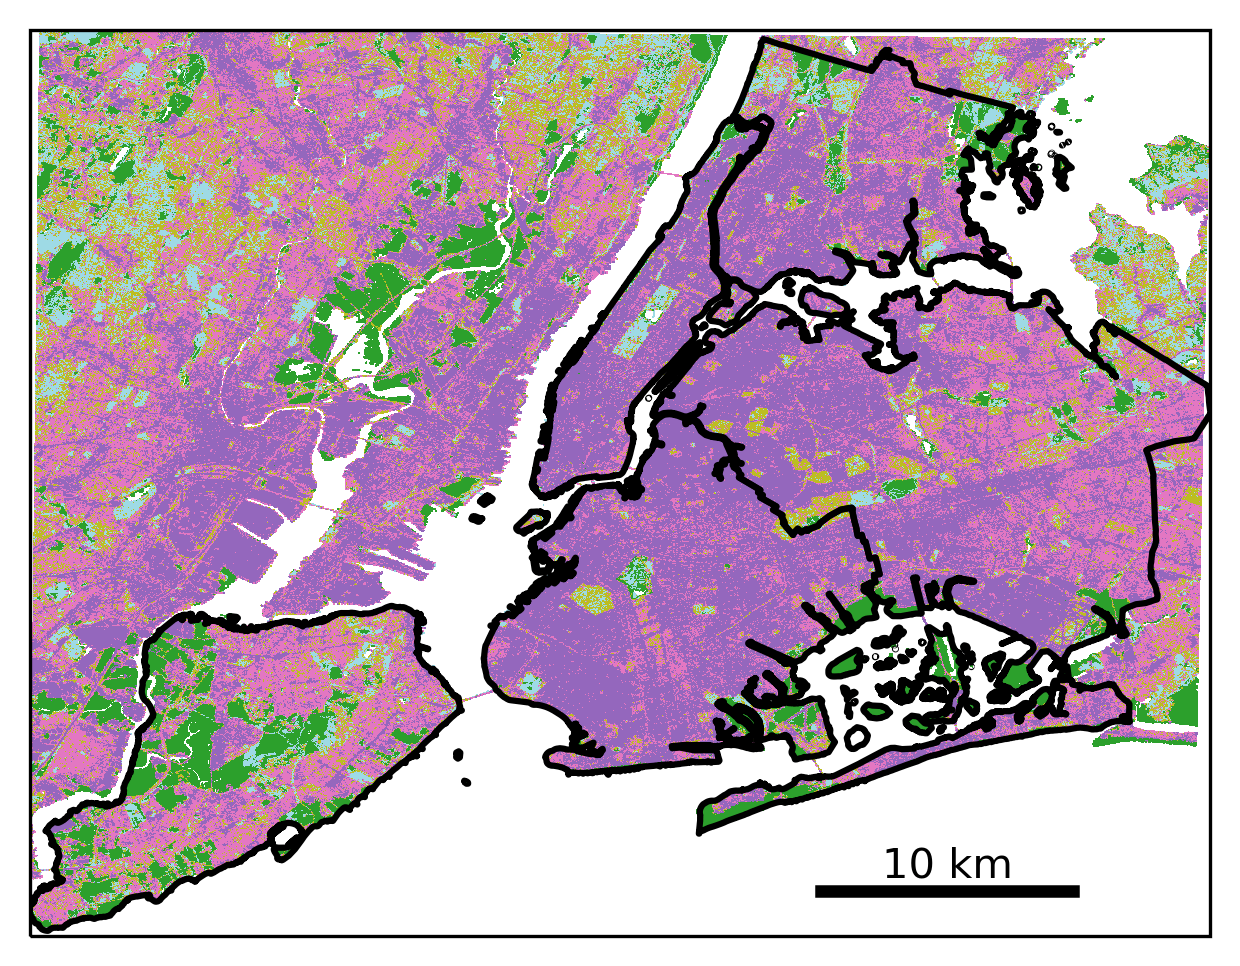
Study authors believe these surprising findings highlight the underappreciated importance of urban greenery in the carbon cycle. The team analyzed vegetation across all of NYC, as well as some densely populated nearby areas, using new hyper-local vegetation maps.
Thanks to these fine-grained vegetation maps, the research team was able to document large amounts of previously unrecognized greenery scattered all over small areas, even in highly developed urban regions. This ultimately led to the finding that all those green spaces collectively are playing an “outsized role” in the exchange of atmospheric gases. Study authors even modeled carbon uptake for every bit of lawn and tree canopy, and studied data provided by local instrument towers measuring the air’s carbon dioxide content continually.
New York is the nation’s emissions capital
Urban areas and neighborhoods make up over 70 percent of human carbon dioxide emissions. New York City, meanwhile, just happens to be the United States’ number one emitter (and the third largest on a global scale).
“There is a lot more greenery than we thought, and that’s what drives our conclusion,” says lead study author Dandan Wei, a postdoctoral researcher at the Columbia Climate School’s Lamont-Doherty Earth Observatory, in a university release. “This tells us that the ecosystem matters in New York City, and if it matters here, it probably matters everywhere else.”
Where is New York’s greenery hiding?
Prior studies focusing on this topic have calculated carbon uptake of vegetation by focusing mostly on contiguous tracts of forest and grassland, but such areas only comprise about 10 percent of the New York metro area. So, using newly available aerial radar imagery of New York City capable of mapping out vegetation across an unprecedented six-inch grid space, Wei and her colleagues included developed areas (the other 90% left out of earlier research).
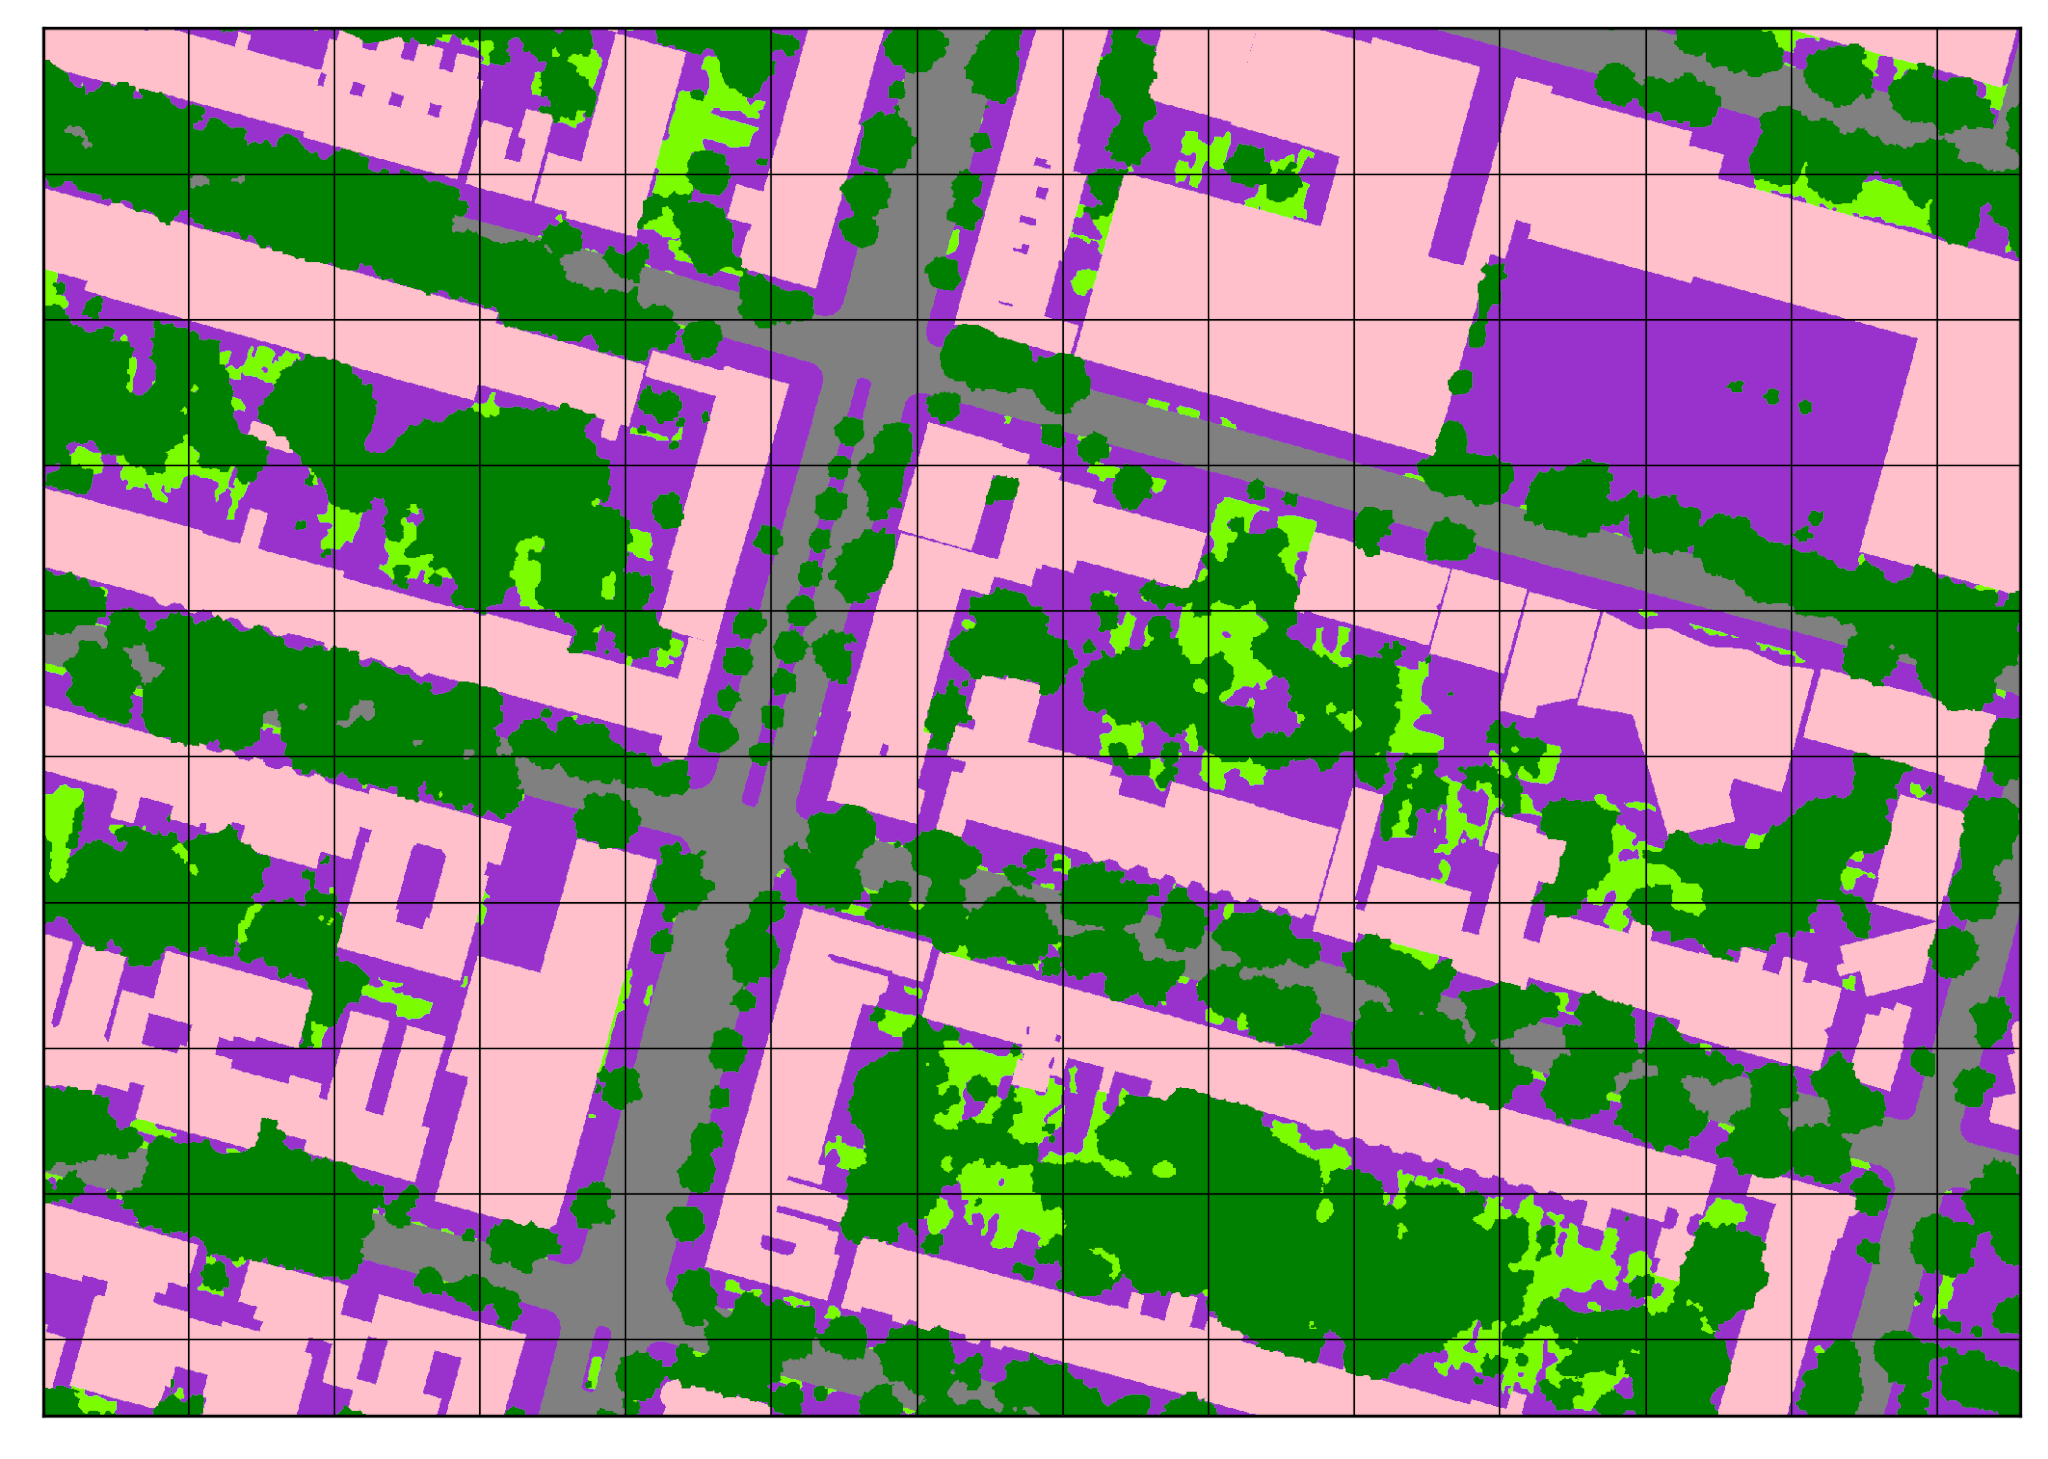
Using this approach, they were able to identify individual street trees, little backyard gardens, overgrown vacant lots and other small features. Additional outlying areas beyond the five boroughs (about a third of the 2,170-square kilometer total study area) were broken down into 30-meter grids.
“Most people have assumed that New York City is just a grey box, that it’s biogenically dead,” adds study co-author Lamont-Doherty atmospheric chemist Roísín Commane. “But just because there’s a concrete sidewalk somewhere doesn’t mean there’s not also a tree that’s shading it.”
Buildings and cars produce the most emissions
All in all, study authors report tree canopies cover some 170 square kilometers of New York City (22% of its area), while grasses account for another 94 square kilometers (12%). To analyze how exactly the greenery interacts with carbon emissions, researchers assessed June-August 2018, a time period in which the New York metro area emitted a total of roughly 14.7 million tons of carbon dioxide. The largest sources were the power industry and energy for buildings, with road transport specifically making up about 1.2 million tons. While global average CO2 levels are currently about 417 parts per million, they often reach 460 or more in NYC.
However, carbon levels would be even higher were it not for all the local vegetation. In newly mapped developed areas, vegetation accounts for nearly 85 percent of the daily carbon uptake. On numerous summer days, total uptake came out to 40 percent of a summer afternoon’s total emissions from all sources. Researchers observed carbon dioxide levels rise in the morning in tandem with traffic, and then lower somewhat in the afternoon, as grass and trees worked their magic.
It’s important to note that carbon uptake only occurs during the local growing season, which in New York runs from mid-April to mid-October. Vegetation located in cities with warmer climates probably plays an even bigger role in carbon uptake, Wei adds.
NYC is getting greener
Meanwhile, the city of New York is actively working to plant more trees. As such, researchers plan to characterize coverage by species, and help figure out the relative benefits of different ones. For example, while fast-growing oaks are a common local choice, studies tell us that they also emit isoprene, a volatile compound that reacts with emissions from vehicles to create polluting ozone. Sweet gums, another common tree, also produce a similar amount of isoprene but feature different growth characteristics.
“More trees are always going to be better, no matter what they are,” Wei concludes. “But we could use an assessment of which ones are the best.”
The study is published in Environmental Research Letters.


