
Photo by RDNE Stock project from Pexels
WASHINGTON — It’s time to raise a pint as millions of Americans start their annual St. Patrick’s Day celebrations. Parades will roll down city streets, bagpipers will be marching, and there will be pub crawls galore across the United States. Not all cities are created equal, though, when it comes to hosting festivities.
According to a survey by WalletHub of 200 of the largest U.S. cities — measuring 15 key metrics of St. Patty’s Day fun — there are plenty of places where you can both wear green and save some green at the same time. The metrics ranged from the number of Irish pubs and restaurants per capita to the cost of a three-star hotel on St. Patrick’s Day and even the local weather forecast.
“St. Patrick’s Day celebrates the Irish, but it’s become a beloved cultural holiday for millions of Americans regardless of their ancestry,” says Cassandra Happe, a WalletHub analyst, in a media release. “The best cities for St. Patrick’s Day combine rich traditions with tasty and affordable food, safe conditions to celebrate, and good weather. Celebrating in one of these cities will increase your chances of having a memorable holiday, as long as you don’t overdo it.”
St. Patrick’s Day In New York? Fuhgeddaboudit!
Despite being home to the country’s oldest and largest St. Patrick’s Day parade, New York City actually missed the top five cities on WalletHub’s 2024 list of places to party. As you might expect, NYC was let down by the cost of celebrating as well as the historically poor weather every March in the Big Apple. Knocking New York out of the top five were two surprising destinations for an Irish extravaganza — Reno, Nevada and Pittsburgh, Pennsylvania!
To no one’s surprise, Boston tops the list of the best cities for St. Patty’s Day celebrations. The city is renowned for its massive St. Patrick’s Day parade, attracting about a million visitors annually. With one of the oldest parade traditions in the country, dating back to 1724, Boston also boasts a significant number of Irish pubs and restaurants per capita, making it a festive and affordable place to celebrate.
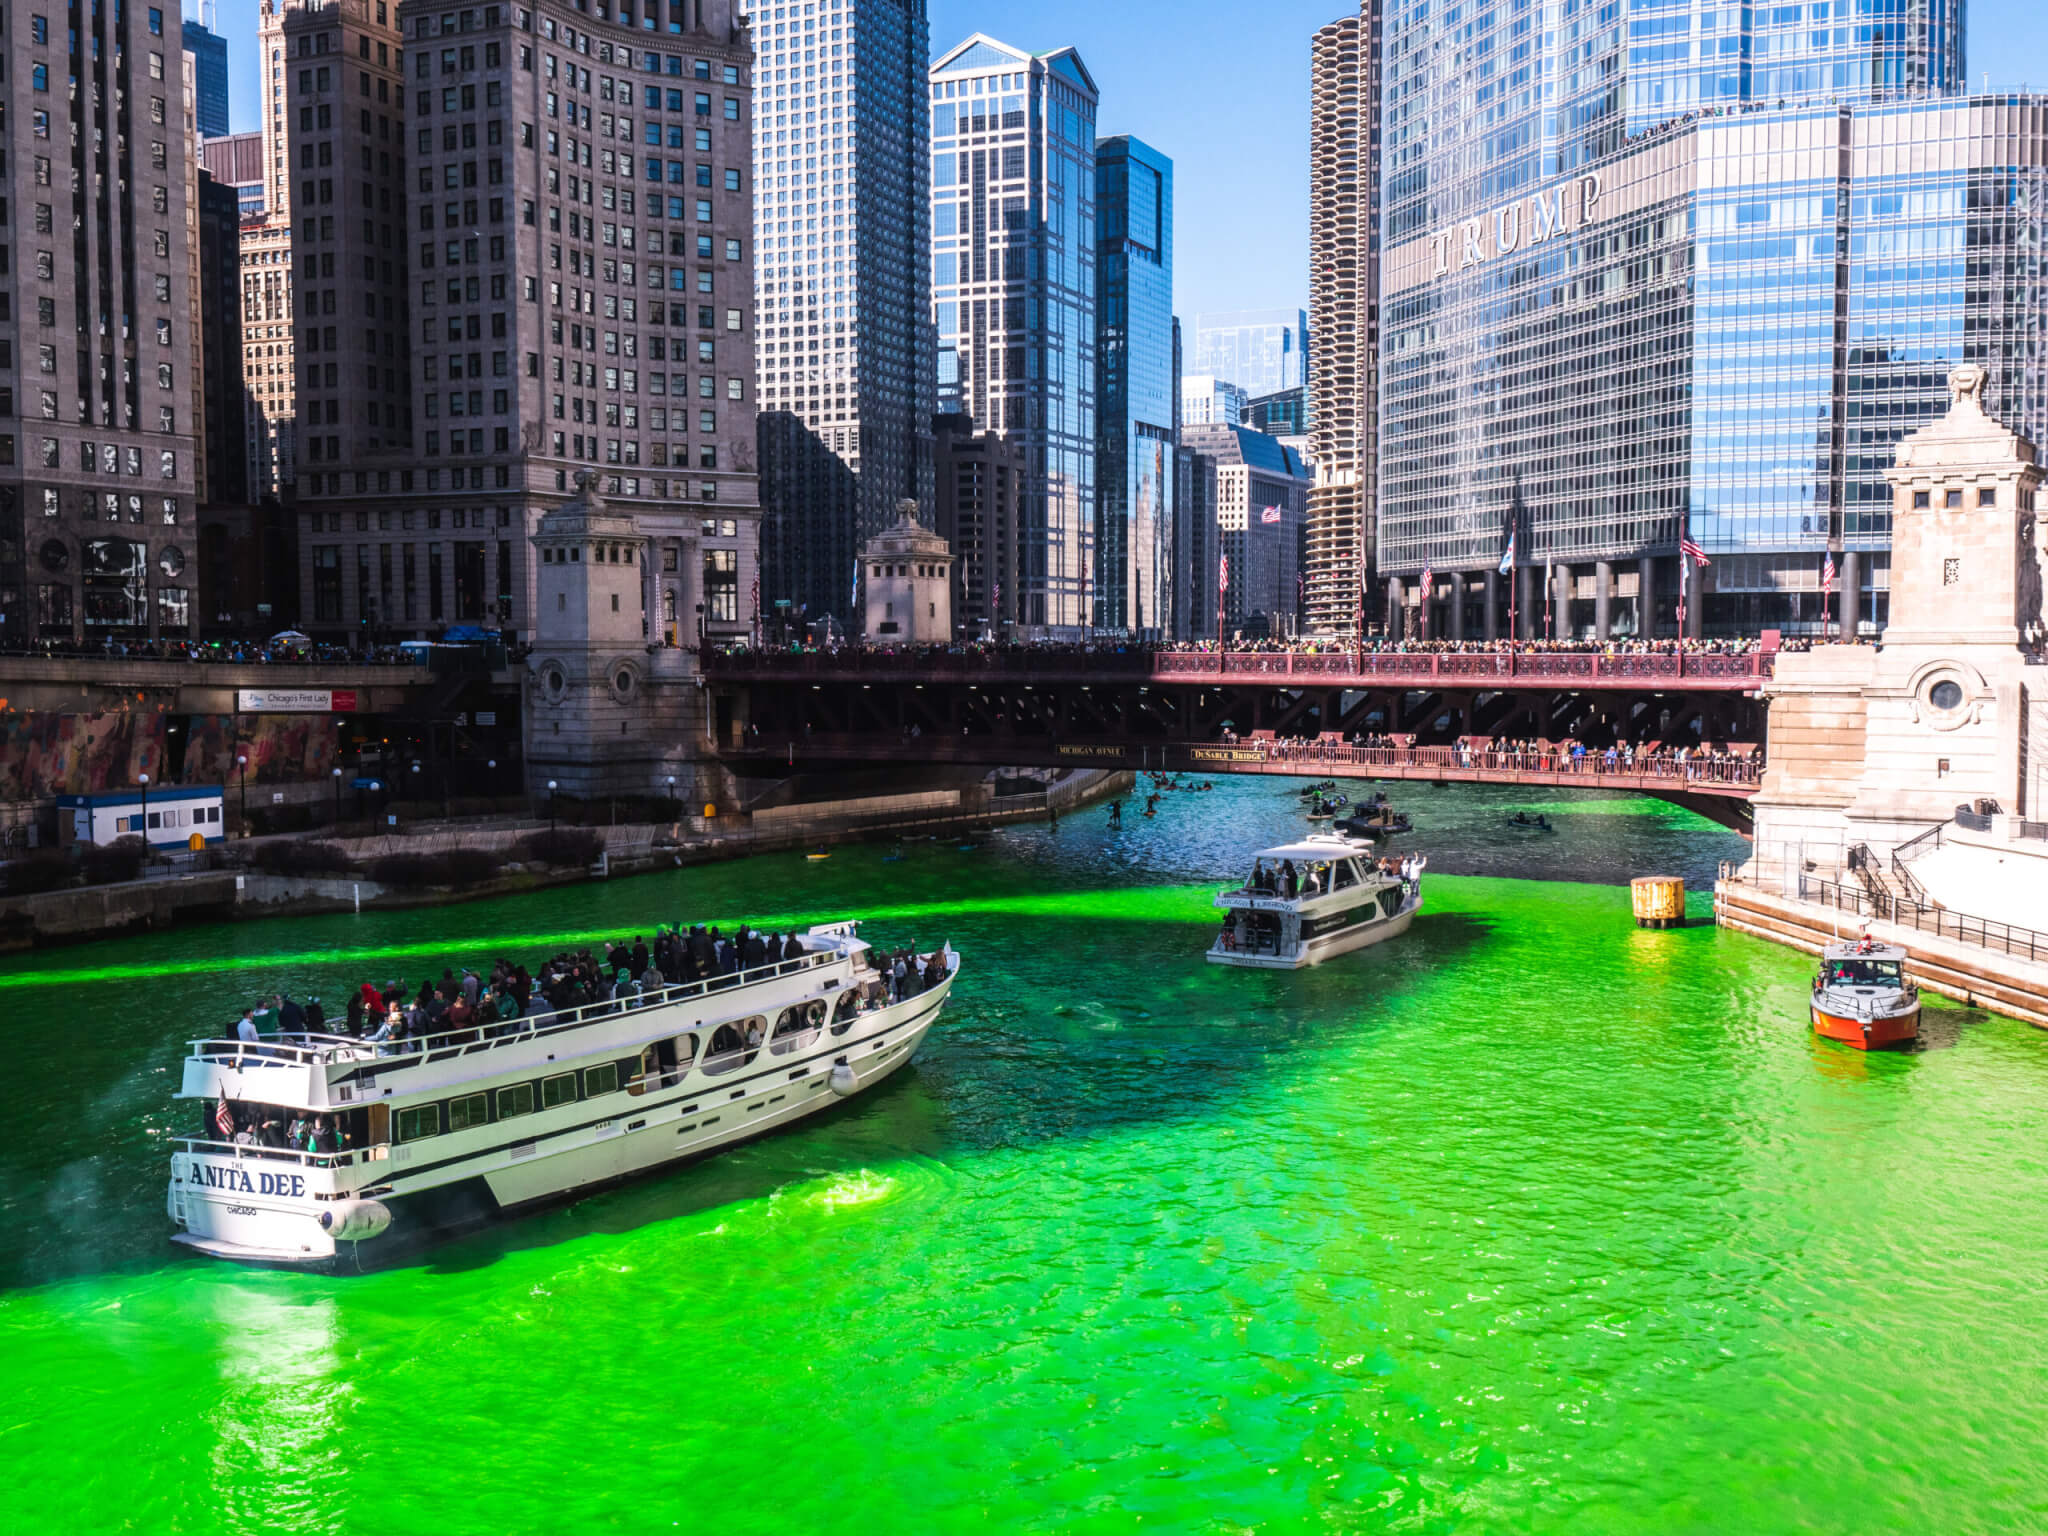
Not to be outdone, Chicago takes second place, especially famous for its unique tradition of turning the Chicago River green. The city’s St. Patrick’s Day parade is among the oldest in the nation, and with a high density of Irish pubs and restaurants, it’s a prime location for holiday revelers.
Ranking third, Savannah, Georgia welcomes half-million visitors each St. Patrick’s Day to enjoy its historic parade and Celtic Cross Ceremony. It’s also the top city for bar density, catering to the holiday’s association with drinking.
When it comes to cities lacking the luck of the Irish, the worst cities to celebrate the holiday include Pomona, California; Grand Prairie, Texas; Arlington, Texas; Paterson, New Jersey; and Bellevue, Washington.
Best Places to Go for St. Patrick’s Day
| Overall Rank | City | Total Score | St. Patrick’s Day Traditions Rank | Costs Rank | Safety & Accessibility Rank | St. Patrick’s Day Weather Rank |
|---|---|---|---|---|---|---|
| 1 | Boston, MA | 68.05 | 1 | 132 | 96 | 131 |
| 2 | Chicago, IL | 63.93 | 3 | 54 | 48 | 194 |
| 3 | Savannah, GA | 63.92 | 38 | 28 | 6 | 5 |
| 4 | Reno, NV | 63.91 | 10 | 78 | 39 | 47 |
| 5 | Pittsburgh, PA | 63.31 | 7 | 111 | 11 | 103 |
| 6 | New York, NY | 61.83 | 5 | 120 | 68 | 132 |
| 7 | Worcester, MA | 61.31 | 12 | 76 | 56 | 127 |
| 8 | Buffalo, NY | 61.03 | 6 | 129 | 59 | 155 |
| 9 | Tampa, FL | 60.71 | 13 | 178 | 34 | 11 |
| 10 | Santa Rosa, CA | 60.44 | 20 | 88 | 36 | 102 |
| 11 | Naperville, IL | 59.84 | 15 | 40 | 38 | 175 |
| 12 | Philadelphia, PA | 59.81 | 2 | 191 | 99 | 114 |
| 13 | Knoxville, TN | 59.39 | 24 | 71 | 159 | 19 |
| 14 | Columbia, SC | 59.21 | 49 | 52 | 124 | 1 |
| 15 | Fort Lauderdale, FL | 58.68 | 9 | 182 | 114 | 12 |
| 16 | Henderson, NV | 58.61 | 44 | 56 | 67 | 42 |
| 17 | Syracuse, NY | 58.05 | 26 | 116 | 7 | 150 |
| 18 | Las Vegas, NV | 57.75 | 43 | 85 | 16 | 56 |
| 19 | New Orleans, LA | 57.61 | 35 | 7 | 128 | 104 |
| 20 | Madison, WI | 57.32 | 32 | 1 | 90 | 185 |
| 21 | Dayton, OH | 57.17 | 8 | 101 | 170 | 138 |
| 22 | St. Paul, MN | 56.35 | 28 | 25 | 93 | 174 |
| 23 | Boise, ID | 56.31 | 65 | 67 | 1 | 146 |
| 24 | Cleveland, OH | 56.3 | 11 | 124 | 176 | 141 |
| 25 | Fort Wayne, IN | 56.25 | 57 | 48 | 5 | 138 |
| 26 | Virginia Beach, VA | 56.24 | 85 | 75 | 26 | 19 |
| 27 | Minneapolis, MN | 56.19 | 19 | 44 | 122 | 197 |
| 28 | San Francisco, CA | 56.15 | 16 | 174 | 109 | 53 |
| 29 | Modesto, CA | 55.95 | 127 | 20 | 19 | 41 |
| 30 | Cincinnati, OH | 55.64 | 34 | 81 | 51 | 127 |
| 31 | Orlando, FL | 55.59 | 30 | 141 | 150 | 15 |
| 31 | St. Petersburg, FL | 55.59 | 14 | 193 | 163 | 18 |
| 33 | Providence, RI | 55.43 | 29 | 135 | 43 | 130 |
| 34 | Richmond, VA | 55.32 | 41 | 140 | 22 | 108 |
| 35 | Lincoln, NE | 55.1 | 90 | 4 | 3 | 190 |
| 36 | Rochester, NY | 55.08 | 17 | 130 | 152 | 158 |
| 37 | Grand Rapids, MI | 54.85 | 70 | 9 | 29 | 159 |
| 38 | Milwaukee, WI | 54.8 | 42 | 15 | 115 | 172 |
| 39 | Fort Collins, CO | 54.76 | 83 | 57 | 8 | 82 |
| 40 | Seattle, WA | 54.72 | 4 | 198 | 80 | 171 |
| 41 | Fresno, CA | 54.55 | 68 | 10 | 179 | 79 |
| 42 | Vancouver, WA | 54.35 | 18 | 171 | 116 | 119 |
| 43 | Overland Park, KS | 54.25 | 27 | 35 | 151 | 187 |
| 44 | Cedar Rapids, IA | 54.1 | 39 | 30 | 77 | 182 |
| 45 | Raleigh, NC | 54.07 | 79 | 102 | 20 | 19 |
| 46 | Des Moines, IA | 54.02 | 40 | 19 | 47 | 198 |
| 47 | Alexandria, VA | 54.02 | 21 | 165 | 108 | 132 |
| 48 | New Haven, CT | 53.73 | 54 | 117 | 21 | 120 |
| 49 | Louisville, KY | 53.48 | 53 | 109 | 15 | 120 |
| 50 | Atlanta, GA | 53.46 | 52 | 133 | 131 | 5 |
| 51 | Wichita, KS | 53.41 | 74 | 8 | 155 | 81 |
| 52 | Huntsville, AL | 53.21 | 69 | 72 | 49 | 56 |
| 53 | Lexington, KY | 53.2 | 76 | 51 | 30 | 64 |
| 54 | Toledo, OH | 52.75 | 48 | 82 | 85 | 151 |
| 55 | Omaha, NE | 52.53 | 50 | 33 | 57 | 195 |
| 56 | Tulsa, OK | 52.45 | 55 | 45 | 167 | 107 |
| 57 | Kansas City, MO | 52.28 | 36 | 5 | 184 | 191 |
| 58 | Olathe, KS | 52.27 | 59 | 11 | 133 | 187 |
| 59 | Rancho Cucamonga, CA | 52.25 | 150 | 22 | 18 | 84 |
| 60 | Akron, OH | 52.23 | 56 | 21 | 156 | 114 |
| 61 | Lubbock, TX | 52.08 | 137 | 18 | 40 | 96 |
| 62 | Warren, MI | 51.99 | 101 | 2 | 135 | 156 |
| 63 | Fayetteville, NC | 51.85 | 140 | 42 | 141 | 2 |
| 64 | Colorado Springs, CO | 51.79 | 51 | 137 | 107 | 55 |
| 65 | Salt Lake City, UT | 51.75 | 60 | 103 | 160 | 37 |
| 66 | Cary, NC | 51.38 | 128 | 59 | 37 | 19 |
| 67 | Thousand Oaks, CA | 51.32 | 72 | 63 | 117 | 84 |
| 68 | Denver, CO | 51.3 | 37 | 153 | 84 | 166 |
| 69 | Clarksville, TN | 51.15 | 96 | 31 | 69 | 161 |
| 70 | Washington, DC | 51.11 | 45 | 176 | 35 | 132 |
| 71 | Rockford, IL | 50.97 | 67 | 14 | 106 | 175 |
| 72 | Scottsdale, AZ | 50.74 | 58 | 179 | 23 | 108 |
| 73 | Springfield, MO | 50.36 | 64 | 12 | 91 | 191 |
| 74 | Hampton, VA | 50.32 | 163 | 89 | 31 | 19 |
| 75 | Charlotte, NC | 50.14 | 98 | 74 | 113 | 2 |
| 76 | Gilbert, AZ | 50.04 | 89 | 184 | 12 | 84 |
| 77 | Jacksonville, FL | 49.95 | 62 | 172 | 129 | 10 |
| 78 | Nashville, TN | 49.8 | 87 | 99 | 50 | 84 |
| 79 | Yonkers, NY | 49.77 | 23 | 196 | 147 | 132 |
| 80 | Waco, TX | 49.76 | 129 | 70 | 25 | 164 |
| 81 | Columbus, OH | 49.73 | 63 | 94 | 123 | 114 |
| 82 | Arlington, VA | 49.7 | 22 | 190 | 172 | 147 |
| 83 | Chesapeake, VA | 49.52 | 112 | 128 | 86 | 29 |
| 84 | Mobile, AL | 49.48 | 94 | 105 | 46 | 43 |
| 85 | Killeen, TX | 49.46 | 167 | 65 | 9 | 79 |
| 86 | Huntington Beach, CA | 49.21 | 80 | 164 | 52 | 56 |
| 87 | Oceanside, CA | 49.19 | 99 | 119 | 94 | 56 |
| 88 | San Diego, CA | 48.98 | 71 | 181 | 27 | 56 |
| 89 | Amarillo, TX | 48.91 | 119 | 34 | 137 | 127 |
| 90 | Baltimore, MD | 48.9 | 81 | 91 | 110 | 114 |
| 91 | Tallahassee, FL | 48.84 | 124 | 87 | 100 | 12 |
| 92 | Newport News, VA | 48.82 | 146 | 121 | 104 | 19 |
| 93 | Cape Coral, FL | 48.8 | 102 | 148 | 45 | 33 |
| 94 | Riverside, CA | 48.69 | 157 | 36 | 75 | 64 |
| 95 | Sterling Heights, MI | 48.62 | 145 | 3 | 126 | 156 |
| 96 | Tacoma, WA | 48.61 | 25 | 175 | 162 | 183 |
| 97 | Columbus, GA | 48.58 | 168 | 32 | 62 | 2 |
| 98 | Oxnard, CA | 48.48 | 143 | 115 | 17 | 64 |
| 99 | Austin, TX | 48.4 | 77 | 90 | 111 | 161 |
| 100 | Portland, OR | 48.34 | 33 | 189 | 166 | 137 |
| 101 | Lakewood, CO | 48.31 | 47 | 86 | 187 | 178 |
| 102 | Durham, NC | 47.79 | 138 | 73 | 87 | 5 |
| 103 | El Paso, TX | 47.63 | 148 | 37 | 55 | 96 |
| 104 | Jersey City, NJ | 47.32 | 82 | 169 | 28 | 132 |
| 105 | Chattanooga, TN | 47.27 | 139 | 27 | 101 | 19 |
| 106 | Augusta, GA | 47.25 | 144 | 47 | 119 | 12 |
| 107 | Port St. Lucie, FL | 47.19 | 78 | 177 | 175 | 19 |
| 108 | Sioux Falls, SD | 47.07 | 61 | 108 | 44 | 199 |
| 109 | Spokane, WA | 46.82 | 46 | 183 | 118 | 170 |
| 110 | Indianapolis, IN | 46.77 | 75 | 134 | 112 | 160 |
| 111 | Salinas, CA | 46.65 | 195 | 24 | 13 | 34 |
| 112 | Winston-Salem, NC | 46.54 | 154 | 84 | 143 | 5 |
| 113 | Montgomery, AL | 46.45 | 176 | 61 | 102 | 29 |
| 114 | St. Louis, MO | 46.39 | 31 | 80 | 200 | 200 |
| 115 | Corpus Christi, TX | 46.26 | 141 | 46 | 65 | 104 |
| 116 | Birmingham, AL | 46.05 | 106 | 39 | 196 | 29 |
| 117 | Joliet, IL | 45.96 | 93 | 50 | 161 | 181 |
| 118 | Tucson, AZ | 45.76 | 88 | 160 | 138 | 108 |
| 119 | Frisco, TX | 45.75 | 108 | 127 | 169 | 63 |
| 120 | Ontario, CA | 45.51 | 188 | 22 | 64 | 64 |
| 121 | Phoenix, AZ | 45.49 | 91 | 168 | 82 | 96 |
| 122 | Stockton, CA | 45.39 | 182 | 60 | 58 | 54 |
| 123 | Honolulu, HI | 45.37 | 95 | 199 | 4 | 52 |
| 124 | Orange, CA | 45.25 | 130 | 112 | 148 | 84 |
| 125 | Shreveport, LA | 45.23 | 162 | 16 | 120 | 161 |
| 126 | Sunnyvale, CA | 44.98 | 160 | 55 | 63 | 46 |
| 127 | Pembroke Pines, FL | 44.92 | 147 | 154 | 83 | 15 |
| 128 | Norfolk, VA | 44.78 | 97 | 157 | 171 | 29 |
| 129 | Tempe, AZ | 44.62 | 86 | 173 | 127 | 108 |
| 130 | North Las Vegas, NV | 44.61 | 175 | 17 | 60 | 56 |
| 131 | Peoria, AZ | 44.45 | 66 | 197 | 145 | 120 |
| 132 | Kansas City, KS | 44.44 | 84 | 5 | 199 | 191 |
| 133 | Eugene, OR | 44.23 | 73 | 195 | 74 | 143 |
| 134 | Elk Grove, CA | 44.05 | 152 | 123 | 154 | 50 |
| 135 | Hollywood, FL | 44.05 | 100 | 170 | 168 | 27 |
| 136 | Sacramento, CA | 43.98 | 103 | 150 | 153 | 48 |
| 137 | Torrance, CA | 43.87 | 126 | 151 | 139 | 96 |
| 138 | San Jose, CA | 43.66 | 164 | 131 | 72 | 36 |
| 139 | Aurora, CO | 43.62 | 153 | 62 | 88 | 144 |
| 140 | McAllen, TX | 43.61 | 184 | 26 | 180 | 34 |
| 141 | Bridgeport, CT | 43.56 | 115 | 98 | 81 | 120 |
| 142 | Salem, OR | 43.46 | 118 | 158 | 76 | 140 |
| 143 | Hialeah, FL | 43.43 | 198 | 167 | 2 | 27 |
| 144 | Pasadena, CA | 43.41 | 132 | 125 | 136 | 64 |
| 145 | Aurora, IL | 43.4 | 117 | 118 | 41 | 175 |
| 146 | Chula Vista, CA | 43.31 | 180 | 159 | 32 | 49 |
| 147 | Oklahoma City, OK | 43.31 | 105 | 64 | 140 | 180 |
| 148 | Irvine, CA | 43.17 | 161 | 146 | 54 | 108 |
| 149 | Corona, CA | 43.14 | 174 | 53 | 92 | 56 |
| 150 | Santa Ana, CA | 42.83 | 187 | 112 | 42 | 64 |
| 151 | Mesa, AZ | 42.75 | 131 | 184 | 61 | 84 |
| 152 | Irving, TX | 42.57 | 116 | 93 | 195 | 118 |
| 153 | Miami, FL | 42.48 | 159 | 136 | 14 | 43 |
| 154 | Fort Worth, TX | 42.25 | 104 | 106 | 178 | 149 |
| 155 | Fremont, CA | 42.24 | 181 | 100 | 142 | 39 |
| 156 | Long Beach, CA | 42.24 | 120 | 187 | 78 | 64 |
| 157 | Santa Clarita, CA | 42.23 | 110 | 149 | 174 | 64 |
| 158 | San Antonio, TX | 42.04 | 109 | 92 | 191 | 104 |
| 159 | Anaheim, CA | 42.04 | 166 | 146 | 103 | 84 |
| 160 | Fontana, CA | 42.01 | 194 | 43 | 70 | 84 |
| 161 | Little Rock, AR | 42.01 | 92 | 79 | 182 | 196 |
| 162 | Los Angeles, CA | 41.93 | 122 | 166 | 121 | 64 |
| 163 | Baton Rouge, LA | 41.91 | 121 | 13 | 192 | 167 |
| 164 | Oakland, CA | 41.8 | 135 | 145 | 183 | 50 |
| 165 | Laredo, TX | 41.66 | 200 | 66 | 33 | 37 |
| 166 | San Bernardino, CA | 41.64 | 189 | 68 | 125 | 64 |
| 167 | Chandler, AZ | 41.45 | 114 | 184 | 79 | 84 |
| 168 | Glendale, CA | 41.4 | 170 | 125 | 97 | 84 |
| 169 | Greensboro, NC | 41.34 | 169 | 152 | 89 | 5 |
| 170 | Pasadena, TX | 41.21 | 185 | 96 | 132 | 64 |
| 171 | West Valley City, UT | 41.15 | 183 | 103 | 134 | 43 |
| 172 | Bakersfield, CA | 40.95 | 173 | 58 | 71 | 84 |
| 173 | Springfield, MA | 40.91 | 133 | 161 | 95 | 120 |
| 174 | Escondido, CA | 40.81 | 165 | 192 | 10 | 64 |
| 175 | McKinney, TX | 40.79 | 111 | 138 | 164 | 152 |
| 176 | Plano, TX | 40.7 | 150 | 83 | 149 | 152 |
| 177 | Detroit, MI | 40.48 | 149 | 29 | 189 | 141 |
| 178 | Newark, NJ | 40.43 | 125 | 180 | 66 | 147 |
| 179 | Garland, TX | 40.16 | 171 | 97 | 73 | 185 |
| 180 | Albuquerque, NM | 39.75 | 142 | 162 | 158 | 96 |
| 181 | Dallas, TX | 38.88 | 123 | 144 | 188 | 152 |
| 182 | Hayward, CA | 38.78 | 190 | 142 | 165 | 40 |
| 183 | Moreno Valley, CA | 38.59 | 196 | 68 | 157 | 96 |
| 184 | Fullerton, CA | 38.58 | 156 | 109 | 177 | 64 |
| 185 | Miramar, FL | 38.57 | 197 | 154 | 98 | 15 |
| 186 | Lancaster, CA | 38.35 | 179 | 139 | 144 | 108 |
| 187 | Brownsville, TX | 38.25 | 199 | 38 | 24 | 82 |
| 188 | Houston, TX | 38.18 | 113 | 122 | 193 | 184 |
| 189 | Glendale, AZ | 37.89 | 136 | 194 | 185 | 64 |
| 190 | Anchorage, AK | 37.54 | 107 | 200 | 53 | 145 |
| 191 | Palmdale, CA | 37.47 | 192 | 143 | 130 | 84 |
| 192 | Jackson, MS | 36.83 | 155 | 41 | 198 | 167 |
| 193 | Memphis, TN | 36.62 | 134 | 49 | 197 | 189 |
| 194 | Mesquite, TX | 36.17 | 178 | 77 | 190 | 164 |
| 195 | Garden Grove, CA | 36.09 | 177 | 112 | 194 | 120 |
| 196 | Pomona, CA | 35.87 | 193 | 156 | 105 | 64 |
| 197 | Grand Prairie, TX | 34.84 | 186 | 107 | 173 | 169 |
| 198 | Arlington, TX | 32.93 | 172 | 95 | 186 | 173 |
| 199 | Paterson, NJ | 32.74 | 191 | 163 | 181 | 120 |
| 200 | Bellevue, WA | 31.3 | 158 | 188 | 146 | 179 |
Note: With the exception of “Total Score,” all of the columns in the table above depict the relative rank of that city, where a rank of 1 represents the best conditions for that metric category.
“Apart from cities with historically large populations descended from Irish immigrants (like Boston or Chicago), St. Patrick’s Day is popular because it breaks up the tedium of late winter, provides an excuse to party, particularly in public, and is a distraction during the long hiatus between the Valentine’s Day holiday and Memorial Day. Americans love holidays,” explains Alexis McCrossen, history professor at Southern Methodist University.
This year, Americans are expected to spend a whopping $7.2 billion on St. Patrick’s Day celebrations.
Methodology
In order to determine the best places to celebrate St. Patrick’s Day, WalletHub compared 200 of the most populated U.S. cities across four key dimensions: 1) St. Patrick’s Day Traditions, 2) Costs, 3) Safety & Accessibility and 4) St. Patrick’s Day Weather.


