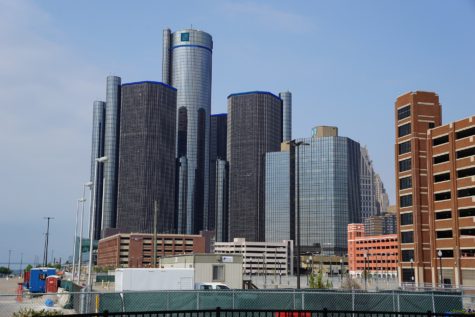
WASHINGTON — Detroit has been touted as being “America’s Comeback City” by some since declaring bankruptcy in 2013, but a 2017 study does The Motor City no favors in its revitalization efforts. According to WalletHub, Detroit is the unhealthiest city in America, as opposed to San Francisco, which got the top grade in a study of the country’s 150 most populated cities.
To reach their findings, WalletHub graded each city using 34 categories as metrics along with a specific weight for each category. The categories were split among four groups that accounted for 25 points each: health care, food, fitness, and green space. The higher the score, the healthier the city.
Categories considered in the study included mental health counselors per capita, cost of medical visit, and quality of public hospitals for health care; healthy restaurants per capita, share of obese residents, and produce consumption for categories under food; fitness clubs per capita, weight loss centers per capital, and share of residents who engage in any physical activity for categories in fitness; and quality of parks, bike score, and walking trails per capita among the categories for green space.
The top five healthiest cities in America were (1-5): San Francisco, Calif.; Salt Lake City, Utah; Scottsdale, Ariz.; Seattle, Wash.; Portland, Ore.
The unhealthiest cities were (146-150): Shreveport, La.; Laredo, TX; Memphis, Tenn.; Brownsville, TX; Detroit, Mich.
The full list from WalletHub.com:
| Overall Rank | City | Total Score | ‘Health Care’ Rank | ‘Food’ Rank | ‘Fitness’ Rank | ‘Green Space’ Rank |
|---|---|---|---|---|---|---|
| 1 | San Francisco, CA | 68.06 | 29 | 1 | 37 | 3 |
| 2 | Salt Lake City, UT | 67.50 | 27 | 3 | 3 | 17 |
| 3 | Scottsdale, AZ | 67.14 | 20 | 16 | 1 | 15 |
| 4 | Seattle, WA | 67.08 | 31 | 4 | 7 | 6 |
| 5 | Portland, OR | 65.16 | 49 | 2 | 18 | 10 |
| 6 | Irvine, CA | 63.96 | 5 | 11 | 12 | 14 |
| 7 | Huntington Beach, CA | 63.23 | 12 | 10 | 13 | 16 |
| 8 | Honolulu, HI | 62.67 | 8 | 5 | 53 | 11 |
| 9 | Washington, DC | 60.24 | 13 | 9 | 73 | 9 |
| 10 | Santa Clarita, CA | 59.67 | 10 | 38 | 44 | 1 |
| 11 | Tempe, AZ | 58.92 | 48 | 15 | 5 | 49 |
| 12 | Fort Lauderdale, FL | 58.87 | 45 | 17 | 14 | 21 |
| 13 | Fremont, CA | 58.82 | 21 | 14 | 35 | 18 |
| 14 | Boise, ID | 58.36 | 18 | 47 | 23 | 12 |
| 15 | Minneapolis, MN | 58.19 | 6 | 22 | 63 | 13 |
| 16 | Rancho Cucamonga, CA | 57.72 | 76 | 77 | 6 | 4 |
| 17 | Denver, CO | 57.65 | 38 | 13 | 22 | 27 |
| 18 | Lincoln, NE | 57.03 | 3 | 51 | 40 | 20 |
| 19 | Madison, WI | 56.99 | 16 | 33 | 38 | 19 |
| 20 | Orlando, FL | 56.44 | 94 | 8 | 19 | 55 |
| 21 | Atlanta, GA | 56.42 | 110 | 30 | 2 | 46 |
| 22 | Glendale, CA | 56.26 | 40 | 39 | 49 | 2 |
| 23 | Santa Rosa, CA | 56.25 | 92 | 20 | 50 | 5 |
| 24 | Plano, TX | 55.96 | 9 | 37 | 24 | 42 |
| 25 | Overland Park, KS | 55.76 | 1 | 88 | 16 | 95 |
| 26 | Vancouver, WA | 55.54 | 80 | 34 | 4 | 73 |
| 27 | Tampa, FL | 55.50 | 62 | 35 | 10 | 45 |
| 28 | Sacramento, CA | 54.66 | 67 | 12 | 66 | 22 |
| 29 | San Diego, CA | 54.61 | 53 | 23 | 41 | 25 |
| 30 | Oakland, CA | 54.41 | 82 | 6 | 81 | 39 |
| 31 | Boston, MA | 54.06 | 33 | 28 | 51 | 31 |
| 32 | Austin, TX | 53.82 | 30 | 21 | 56 | 33 |
| 33 | San Jose, CA | 53.78 | 4 | 18 | 75 | 64 |
| 34 | Richmond, VA | 53.56 | 52 | 41 | 28 | 43 |
| 35 | Raleigh, NC | 53.55 | 11 | 44 | 15 | 84 |
| 36 | Peoria, AZ | 53.46 | 64 | 106 | 25 | 7 |
| 37 | Reno, NV | 53.17 | 113 | 19 | 29 | 36 |
| 38 | St. Louis, MO | 53.02 | 108 | 49 | 20 | 28 |
| 39 | Tallahassee, FL | 53.01 | 56 | 119 | 34 | 8 |
| 40 | Sioux Falls, SD | 52.76 | 2 | 120 | 21 | 93 |
| 41 | Springfield, MO | 52.56 | 15 | 123 | 26 | 37 |
| 42 | Miami, FL | 52.46 | 105 | 7 | 84 | 51 |
| 43 | Virginia Beach, VA | 52.28 | 24 | 66 | 45 | 35 |
| 44 | Pittsburgh, PA | 51.71 | 23 | 45 | 33 | 72 |
| 45 | Spokane, WA | 51.64 | 78 | 48 | 47 | 29 |
| 46 | St. Paul, MN | 51.50 | 19 | 60 | 61 | 38 |
| 47 | Gilbert, AZ | 51.44 | 22 | 75 | 8 | 80 |
| 48 | Chandler, AZ | 51.27 | 32 | 63 | 11 | 100 |
| 49 | Garden Grove, CA | 51.23 | 36 | 25 | 88 | 67 |
| 50 | Long Beach, CA | 51.07 | 51 | 24 | 80 | 40 |
| 51 | Pembroke Pines, FL | 50.56 | 25 | 71 | 27 | 123 |
| 52 | Rochester, NY | 50.40 | 107 | 29 | 72 | 30 |
| 53 | Durham, NC | 50.32 | 58 | 58 | 36 | 62 |
| 54 | Cincinnati, OH | 50.28 | 119 | 26 | 31 | 68 |
| 55 | Colorado Springs, CO | 50.14 | 28 | 82 | 57 | 44 |
| 56 | Chesapeake, VA | 50.08 | 35 | 98 | 68 | 23 |
| 57 | Worcester, MA | 49.73 | 68 | 68 | 39 | 70 |
| 58 | St. Petersburg, FL | 49.72 | 66 | 65 | 30 | 66 |
| 59 | Anaheim, CA | 49.69 | 41 | 27 | 71 | 76 |
| 60 | Aurora, CO | 49.63 | 34 | 52 | 60 | 65 |
| 61 | Las Vegas, NV | 49.23 | 135 | 43 | 9 | 90 |
| 62 | Oceanside, CA | 49.13 | 73 | 93 | 32 | 83 |
| 63 | Grand Rapids, MI | 49.10 | 14 | 59 | 97 | 56 |
| 64 | Henderson, NV | 49.05 | 101 | 118 | 17 | 48 |
| 65 | Tacoma, WA | 48.96 | 109 | 54 | 42 | 77 |
| 66 | Albuquerque, NM | 48.52 | 42 | 56 | 69 | 58 |
| 67 | Buffalo, NY | 48.25 | 77 | 40 | 77 | 58 |
| 68 | Anchorage, AK | 47.82 | 100 | 55 | 99 | 26 |
| 69 | Yonkers, NY | 47.52 | 37 | 57 | 104 | 53 |
| 70 | Omaha, NE | 47.06 | 17 | 89 | 67 | 92 |
| 71 | Glendale, AZ | 46.79 | 79 | 87 | 86 | 41 |
| 72 | Knoxville, TN | 46.40 | 128 | 86 | 64 | 34 |
| 73 | Little Rock, AR | 46.23 | 57 | 122 | 52 | 63 |
| 74 | Modesto, CA | 46.20 | 122 | 104 | 54 | 50 |
| 75 | Los Angeles, CA | 45.95 | 70 | 32 | 109 | 78 |
| 76 | Des Moines, IA | 45.76 | 7 | 114 | 92 | 98 |
| 77 | Mesa, AZ | 45.66 | 71 | 78 | 46 | 112 |
| 78 | Providence, RI | 45.58 | 134 | 74 | 78 | 32 |
| 79 | Chicago, IL | 44.78 | 60 | 69 | 130 | 47 |
| 80 | Tucson, AZ | 44.68 | 121 | 70 | 65 | 81 |
| 81 | Charlotte, NC | 44.30 | 46 | 109 | 55 | 119 |
| 82 | Norfolk, VA | 44.15 | 98 | 79 | 110 | 54 |
| 83 | Jersey City, NJ | 44.15 | 55 | 31 | 136 | 94 |
| 84 | Baltimore, MD | 44.01 | 125 | 53 | 120 | 52 |
| 85 | Phoenix, AZ | 44.00 | 96 | 85 | 91 | 75 |
| 86 | Port St. Lucie, FL | 43.97 | 91 | 131 | 48 | 125 |
| 87 | Newport News, VA | 43.77 | 75 | 90 | 103 | 87 |
| 88 | Huntsville, AL | 43.72 | 123 | 117 | 70 | 60 |
| 89 | Santa Ana, CA | 43.63 | 95 | 50 | 119 | 91 |
| 90 | Philadelphia, PA | 43.42 | 126 | 46 | 131 | 57 |
| 91 | New Orleans, LA | 43.13 | 146 | 121 | 87 | 24 |
| 92 | Aurora, IL | 43.10 | 44 | 94 | 124 | 88 |
| 93 | Irving, TX | 42.91 | 103 | 72 | 111 | 99 |
| 94 | Fontana, CA | 42.90 | 133 | 95 | 83 | 86 |
| 95 | Lexington-Fayette, KY | 42.75 | 26 | 113 | 98 | 108 |
| 96 | New York, NY | 42.65 | 85 | 36 | 146 | 61 |
| 97 | Riverside, CA | 42.50 | 124 | 76 | 74 | 104 |
| 98 | Garland, TX | 42.50 | 81 | 62 | 106 | 114 |
| 99 | Nashville, TN | 42.42 | 54 | 105 | 101 | 96 |
| 100 | Greensboro, NC | 42.39 | 72 | 132 | 85 | 71 |
| 101 | Fort Wayne, IN | 42.11 | 47 | 135 | 62 | 101 |
| 102 | Lubbock, TX | 42.06 | 63 | 130 | 58 | 113 |
| 103 | Chula Vista, CA | 41.88 | 65 | 110 | 90 | 116 |
| 104 | Milwaukee, WI | 41.65 | 61 | 81 | 138 | 85 |
| 105 | Oxnard, CA | 41.55 | 111 | 80 | 135 | 79 |
| 106 | Kansas City, MO | 41.52 | 39 | 108 | 113 | 106 |
| 107 | Ontario, CA | 41.36 | 136 | 64 | 128 | 110 |
| 108 | Akron, OH | 41.05 | 74 | 99 | 132 | 89 |
| 109 | Grand Prairie, TX | 40.50 | 90 | 83 | 144 | 105 |
| 110 | Arlington, TX | 40.26 | 86 | 97 | 100 | 129 |
| 111 | Dallas, TX | 39.95 | 104 | 67 | 118 | 134 |
| 112 | Jacksonville, FL | 39.84 | 129 | 101 | 96 | 117 |
| 113 | Cape Coral, FL | 39.69 | 118 | 136 | 76 | 109 |
| 114 | Columbus, OH | 39.66 | 83 | 107 | 116 | 118 |
| 115 | Louisville, KY | 39.22 | 115 | 96 | 112 | 121 |
| 116 | Wichita, KS | 39.11 | 59 | 129 | 82 | 131 |
| 117 | Fayetteville, NC | 39.10 | 120 | 145 | 59 | 140 |
| 118 | Moreno Valley, CA | 39.03 | 137 | 100 | 142 | 74 |
| 119 | Birmingham, AL | 38.89 | 141 | 102 | 95 | 130 |
| 120 | Stockton, CA | 38.41 | 112 | 73 | 127 | 126 |
| 121 | Houston, TX | 38.37 | 87 | 103 | 114 | 138 |
| 122 | Cleveland, OH | 38.27 | 139 | 61 | 141 | 103 |
| 123 | Amarillo, TX | 38.15 | 88 | 138 | 121 | 82 |
| 124 | Fort Worth, TX | 37.88 | 106 | 91 | 108 | 146 |
| 125 | Winston-Salem, NC | 37.72 | 99 | 144 | 122 | 97 |
| 126 | Columbus, GA | 37.51 | 138 | 134 | 126 | 69 |
| 127 | Jackson, MS | 37.41 | 50 | 139 | 93 | 148 |
| 128 | San Antonio, TX | 37.34 | 84 | 112 | 115 | 142 |
| 129 | Montgomery, AL | 37.08 | 131 | 141 | 89 | 128 |
| 130 | Tulsa, OK | 36.97 | 89 | 125 | 102 | 136 |
| 131 | Fresno, CA | 36.92 | 132 | 111 | 123 | 122 |
| 132 | Chattanooga, TN | 36.91 | 144 | 147 | 79 | 102 |
| 133 | Hialeah, FL | 36.88 | 102 | 42 | 150 | 141 |
| 134 | Indianapolis, IN | 36.85 | 93 | 115 | 125 | 135 |
| 135 | San Bernardino, CA | 36.60 | 147 | 92 | 134 | 115 |
| 136 | Bakersfield, CA | 36.40 | 127 | 116 | 105 | 139 |
| 137 | Oklahoma City, OK | 35.78 | 69 | 126 | 129 | 137 |
| 138 | Mobile, AL | 35.61 | 149 | 148 | 43 | 149 |
| 139 | El Paso, TX | 35.29 | 116 | 137 | 117 | 124 |
| 140 | Baton Rouge, LA | 35.18 | 145 | 140 | 94 | 107 |
| 141 | Augusta, GA | 34.32 | 140 | 124 | 107 | 150 |
| 142 | Toledo, OH | 33.92 | 97 | 127 | 139 | 143 |
| 143 | Newark, NJ | 33.28 | 143 | 84 | 147 | 133 |
| 144 | North Las Vegas, NV | 32.69 | 142 | 133 | 145 | 111 |
| 145 | Corpus Christi, TX | 32.56 | 130 | 143 | 133 | 132 |
| 146 | Shreveport, LA | 32.44 | 114 | 149 | 137 | 147 |
| 147 | Laredo, TX | 30.65 | 43 | 146 | 149 | 127 |
| 148 | Memphis, TN | 29.77 | 150 | 128 | 140 | 144 |
| 149 | Brownsville, TX | 28.54 | 117 | 150 | 143 | 145 |
| 150 | Detroit, MI | 28.37 | 148 | 142 | 148 | 120 |
The WalletHub.com list also included a breakdown of best and worst cities for several of the categories, including the cities with the highest and lowest costs of medical care, highest and lowest premature death rates, and highest and lowest costs of memberships to fitness centers. They also break down the weighted values per category to fully explain their methodology.


The criteria look very flawed to me: I don’t believe that the number of health clubs or number of weight loss centers correlates to overall health. In fact it could indicate the opposite; there’s a greater need for such amenities where physical fitness or weight is unhealthy. Norway might not have as many health clubs or weigh loss centers as a typical US city, but that wouldn’t make it a less healthy place to live. I think the fact that SF comes out on top by itself is an indication of errors in the studies’ premises. The criteria used over weight a consumptive society that purchases health indicators, and under values health in those communities where, say, outdoor activities that aren’t purchased aren’t counted. If every single person in a community hiked in the mountains every day, this study would weight them as being unhealthy if they don’t have a lot of fitness clubs or weight loss centers. Fail.
Dear Detroit: Call Chelsea. She wrote a book “Governing Global Health: Who Runs the World and Why?”. Of course a news report says she does not answer the question in the book, so you just know she is looking for a consulting gig (fees paid in advance, If I know the Clintons), and she is a Democrat. You can thank me later.
Corruption from top down is why these once great cities fail. Drain the monkey swamp.
Oakland at #30. The whole thing is a false wash.
The air in Detroit contains a very large amount of heavy metals. Specifically lead and copper in large chunks traveling anywhere from 900 ft./s to about 3000 ft./s. Combine that with broken crack pipes and dirty needles that litter the ground, it sure impacts the health of a city.