(Credit: Babul Hosen/Shutterstock)
SAN DIEGO — As California’s climate transforms, so too does its public health landscape. Valley fever, a once-rare fungal disease, is emerging as an unlikely beneficiary of global warming, challenging scientists to decode its cryptic patterns before it’s too late.
Valley fever, caused by inhaling spores of the fungus Coccidioides, has been on the rise in recent years, leaving researchers scrambling to understand its patterns. According to the California Department of Public Health, cases have tripled twice over in just the past decade — once from 2014 to 2018 and again from 2018 to 2022. This surge has turned a once-obscure illness into a significant public health threat, one that often masquerades as other respiratory infections, including COVID-19.
A concerning study published in The Lancet Regional Health – Americas sheds new light on the seasonal rhythms of this enigmatic disease and how climate change might be choreographing its deadly dance.
The study, led by researchers from the University of California-San Diego, the University of California-Berkeley, and other institutions, analyzed over 89,000 cases of valley fever reported in California between 2000 and 2021. Their findings reveal a complex interplay between climate conditions and disease outbreaks, with drought playing a surprising role in shaping the seasonal peaks of infection.
Also known as coccidioidomycosis, Valley fever is not your average fungal infection. Unlike common fungi that might cause athlete’s foot or yeast infections, Coccidioides has evolved to thrive in the harsh, dry soils of the southwestern United States. When these fungal spores are disturbed – perhaps by construction work, farming, or even a strong gust of wind – they can become airborne and find their way into human lungs, potentially causing symptoms ranging from mild flu-like illness to severe pneumonia.
Valley Fever history in California
Valley fever wasn’t always such a pressing concern. In fact, the disease had nearly vanished from public health radar screens several decades ago. In the 1940s and 1950s, the wide-scale use of oil as a dust suppressant on roads and in agriculture dramatically reduced the aerosolization of Coccidioides spores. This practice, combined with improved diagnostic techniques and treatment options, led to a significant decline in Valley fever cases. However, as environmental concerns grew about the impacts of oil spraying on soil and water quality, the practice was largely abandoned by the 1970s. This shift, coupled with increasing development in arid areas and changing climate patterns, set the stage for Valley fever’s resurgence.
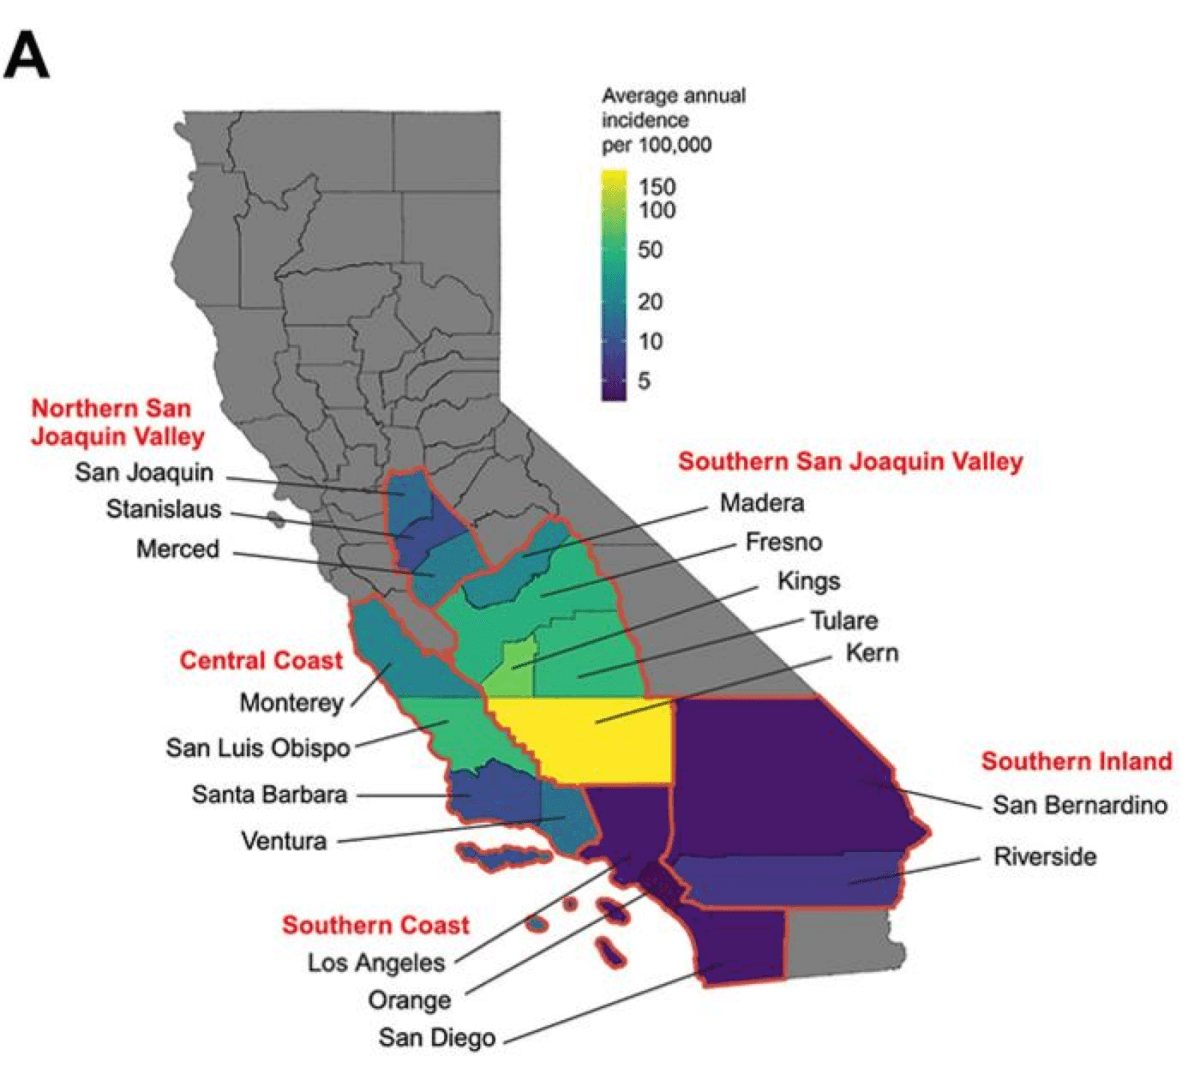
Researchers discovered that Valley fever cases in California typically peak between September and November, at the tail end of the dry season. This suggests that the riskiest time for exposure to the fungus is actually earlier, between July and September, given the time it takes for symptoms to appear and diagnoses to be made. However, this pattern isn’t set in stone across the state. The study found significant variations in the timing and intensity of these seasonal peaks across different regions and years. The San Joaquin Valley and Central Coast regions showed the most pronounced seasonal surges, with the San Joaquin Valley experiencing earlier peaks.
“Most seasonal infectious diseases show a peak in cases every year, so we were surprised to see that there were certain years during which few or no counties had a seasonal peak in Valley fever cases,” notes first author Alexandra Heaney, Ph.D., assistant professor at the UCSD Herbert Wertheim School of Public Health and Human Longevity Science, in a statement. “This made us wonder what was driving these differences in seasonality between years, and based on the timing we observed, we hypothesized that drought might be playing a role.”
Indeed, drought emerged as a key player in Valley fever’s seasonal patterns. Yet one of the most intriguing findings of the study relates to the impact of drought on valley fever’s seasonal rhythm. Contrary to what one might expect, periods of severe drought actually suppressed the seasonal peaks of the disease. However, when drought conditions ended and were followed by wetter periods, the seasonal surge in cases became more pronounced.
This drought-related pattern might be explained by the fungus’s life cycle and its relationship with other soil microbes and animals. During prolonged dry spells, Coccidioides may gain a competitive edge over other microorganisms less adapted to arid conditions. When moisture returns to the soil, the fungus can then flourish in its newly expanded territory, leading to more spores and potentially more infections.
Another hypothesis links Valley fever’s drought dynamics to its impact on rodent populations. Rodents, which can host the Coccidioides fungus, often decline during droughts. Their deaths may provide an important nutrient source for the fungus, allowing it to survive and spread more easily in drought conditions.
The study’s findings have important implications for public health efforts in California and other regions where valley fever is endemic. Understanding the seasonal patterns of the disease can help healthcare providers be more vigilant during peak months and guide public health messaging about when to take extra precautions against dust exposure.
“Knowing when the Valley fever season starts and how intense it will be can help health care practitioners know when they should be on high alert for new cases,” says corresponding author Justin Remais, Ph.D., professor at UC Berkeley School of Public Health. “This is the first study to pin down exactly when disease risk is highest in all of California’s endemic counties, as well as places where the disease is newly emerging.”
Looking ahead, the researchers warn that climate change could further complicate valley fever’s seasonal dance. As California faces the prospect of more frequent and severe droughts, followed by periods of intense rainfall, the conditions that drive valley fever outbreaks may become more common. This could lead to more cases concentrated in specific months, potentially overwhelming healthcare systems and putting more people at risk.
“This work is an important example of how infectious diseases are influenced by climate conditions,” adds Heaney. “Even though droughts appear to decrease Valley fever cases in the short term, the net effect is an increase in cases over time, particularly as we experience more frequent and severe droughts due to climate change.”
Paper Summary
Methodology
The researchers analyzed data on all reported cases of valley fever in California from 2000 to 2021, focusing on 17 counties with consistently high incidence rates. They used a mathematical technique called wavelet analysis to examine the seasonal patterns in disease incidence. This method allowed them to identify the strength and timing of seasonal cycles in each county over time.
The researchers also looked at climate data, including rainfall and temperature, and calculated a measure of drought severity called the standardized precipitation-evapotranspiration index (SPEI). They then used statistical models to explore how these climate factors related to the seasonal patterns of valley fever.
Key Results
The study found that valley fever cases in California typically peak between September and November, with the lowest number of cases occurring from April to June. However, there was significant variation in these patterns across different counties and years. Some regions, like the Southern San Joaquin Valley, showed stronger and earlier seasonal peaks compared to coastal areas.
The researchers also discovered that drought conditions were associated with weaker seasonal patterns, but when droughts ended, the seasonal peaks became more pronounced. Longer droughts had a stronger impact on these seasonal patterns.
Study Limitations
The study relied on reported cases of valley fever, which may not perfectly reflect the actual presence of the fungus in the environment. There could be delays in diagnosis and reporting that affect the timing of the seasonal patterns observed. The researchers also note that aggregating data at the county level might mask more localized variations in disease patterns.
Additionally, the study focused on California and specifically on areas where the C. immitis species of the fungus is dominant, so the findings may not apply to other regions or to areas where a different species, C. posadasii, is more common.
Discussion & Takeaways
The researchers conclude that drought conditions don’t increase the risk of valley fever uniformly throughout the year. Instead, they promote increased risk concentrated within a specific calendar period, typically September to December. This information could be crucial for public health preparedness, helping officials target prevention efforts and public messaging during the most high-risk periods.
The study also suggests that as climate change leads to more frequent droughts and extreme weather patterns in California, we may see changes in the seasonal dynamics of valley fever. This could include periods of suppressed disease incidence during droughts, followed by sharp increases in cases when drought conditions end.
Funding & Disclosures
The research was supported by the National Institute of Allergy and Infectious Diseases of the National Institutes of Health. The authors declared no conflicts of interest.


