(Photo by timyee on Shutterstock)
BLACKSBURG, Va. — In recent years, climate change and rising sea levels have dominated headlines, but there’s an overlooked aspect that poses a significant threat to coastal communities, especially along the East Coast: land subsidence, or the gradual sinking of the ground. The alarming study highlights this alarming trend, showing how subsidence, coupled with sea-level rise (SLR), is exposing coastal regions, including major cities, to increased risks. This issue is particularly pressing in areas like Baltimore, Boston, New York, and Miami, where subsidence rates exceed 1 millimeters per year in some areas, and as much as 5 millimeters in others.
The study is a wake-up call for policymakers, city planners, and communities to integrate subsidence into their climate change adaptation strategies.
A collaboration by researchers at Virginia Tech and the U.S. Geological Survey, the team utilized advanced remote sensing technology to assess land movement. It found that while sea levels are steadily rising due to climate change, the land is simultaneously sinking, exacerbating flood risks and threatening infrastructure. This decline at the ocean’s edge well outpaces the global sea level rise, posing a grave threat to urban centers up and down the Atlantic.
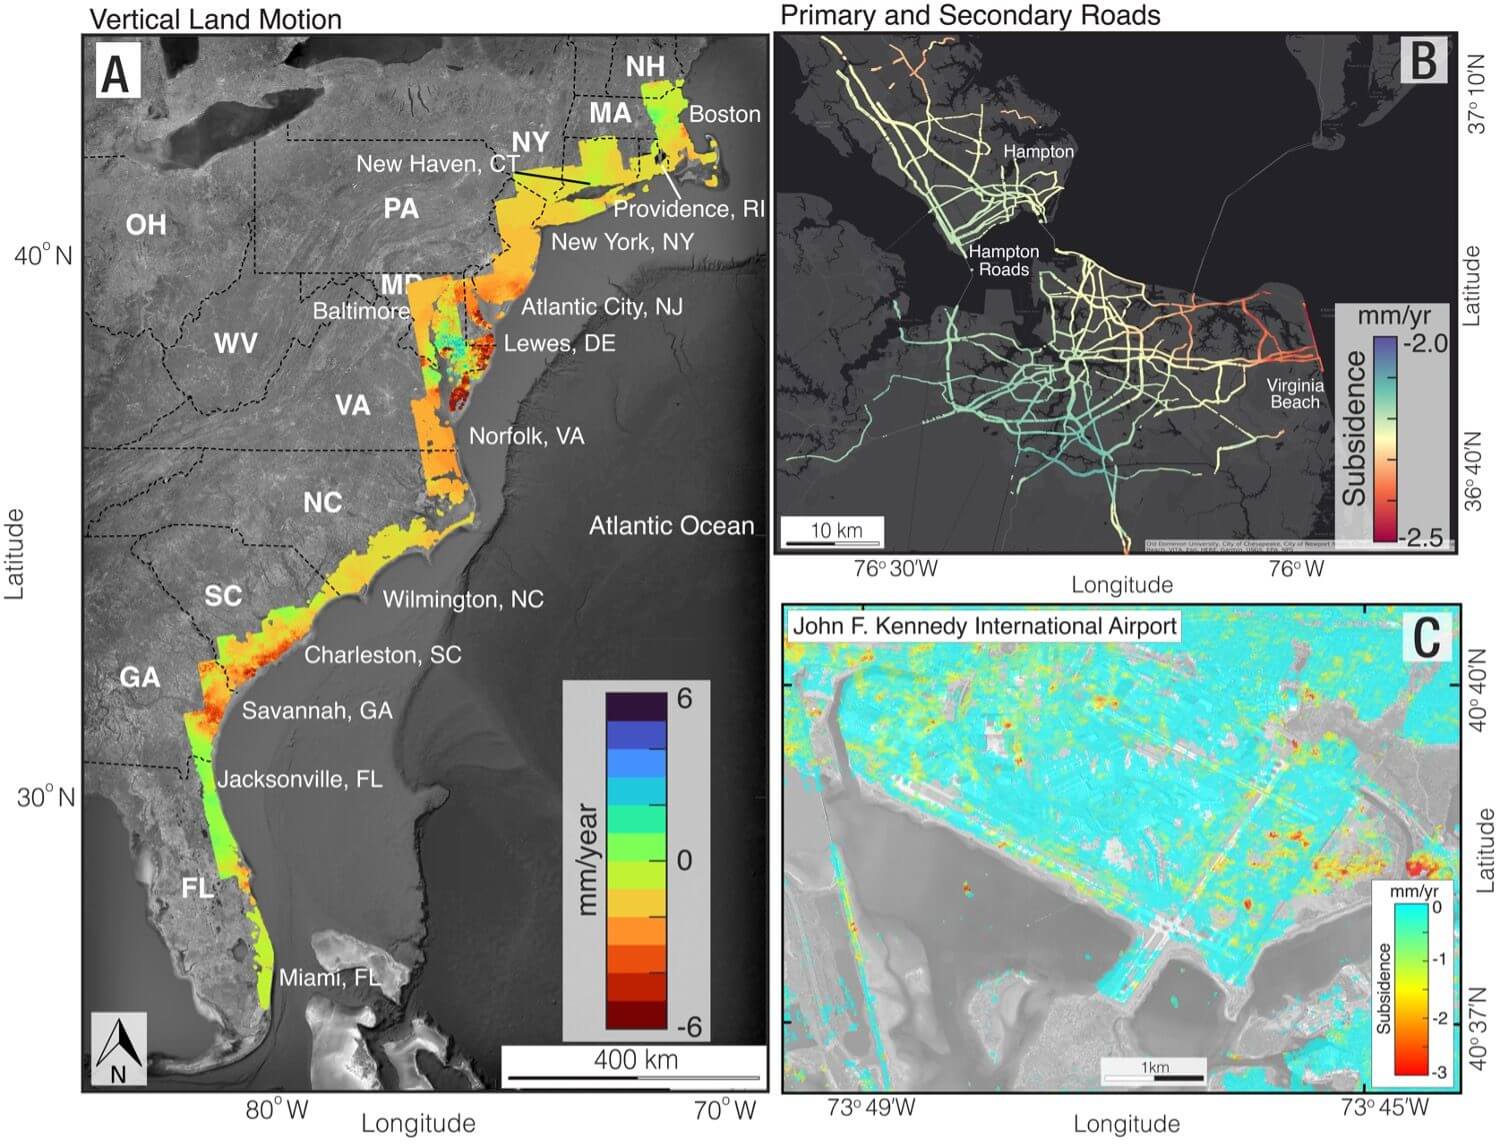
One of the startling revelations is the impact on infrastructure. Roads, railways, and critical facilities like hospitals and airports are increasingly vulnerable. According to their estimates, over 70% of certain infrastructures like schools and hospitals are on land experiencing sinking.
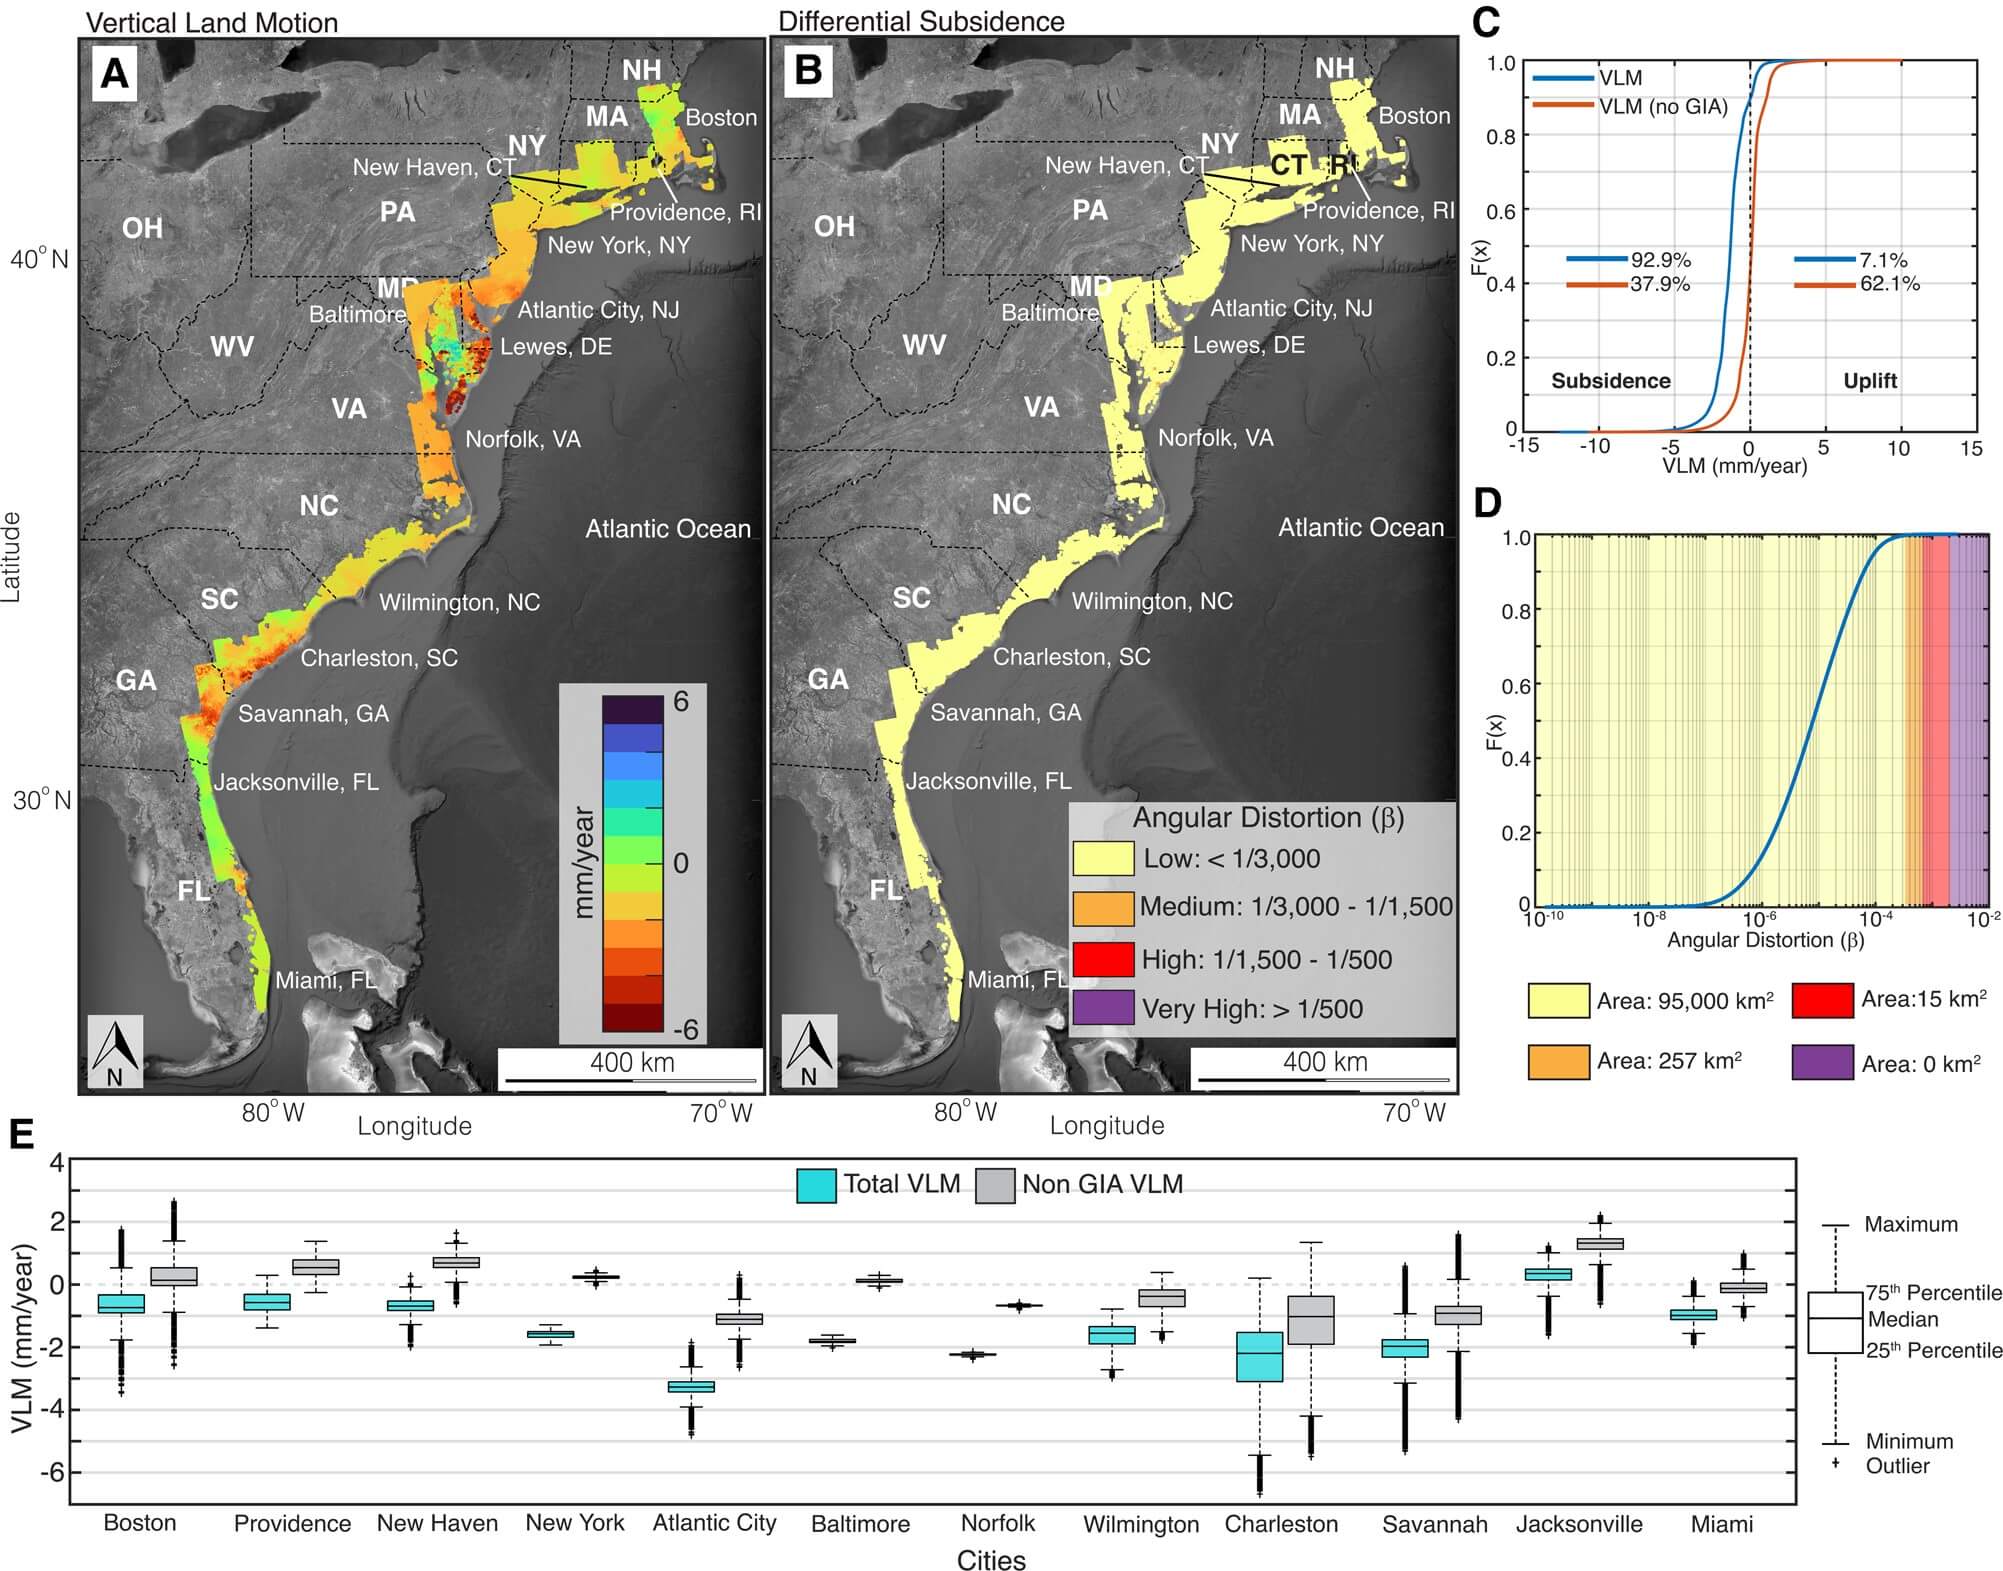
“We measured subsidence rates of 2 mm per year affecting more than 2 million people and 800,000 properties on the East Coast. We know to some extent that the land is sinking. Through this study, we highlight that sinking of the land is not an intangible threat. It affects you and I and everyone; it may be gradual, but the impacts are real,” warns co-author Manoochehr Shirzaei, an associate professor at Virginia Tech’s Earth Observation and Innovation Lab, in a statement.
Subsidence doesn’t just mean a higher risk of floods. It can lead to angular distortion, where the land surface tilts, affecting the structural integrity of buildings and infrastructure. Fortunately, most of the East Coast shows low levels of this risk, but the threat shouldn’t be ignored.
The economic implications are significant. Coastal flooding, exacerbated by subsidence, can lead to costly damage and disrupt lives. Cities like Norfolk and Baltimore are already grappling with frequent flooding, and the study predicts this will only worsen.
“Here, the problem is not just that the land is sinking. The problem is that the hotspots of sinking land intersect directly with population and infrastructure hubs,” says lead author Leonard Ohenhen, a graduate student working with Shirzaei at Virginia Tech. “For example, significant areas of critical infrastructure in New York, including JFK and LaGuardia airports and its runways, along with the railway systems, are affected by subsidence rates exceeding 2 mm per year. The effects of these right now and into the future are potential damage to infrastructure and increased flood risks.”
To combat this, the study emphasizes the importance of proactive policies and regular monitoring. Investing in infrastructure maintenance and adapting to these changes are crucial steps. The research also highlights the role of new technologies like satellite observations in managing these challenges.
High-Res Satellite Photos Confirm East Coast Sinking
The study employed a sophisticated approach to assess land subsidence using remote sensing technology, specifically through Interferometric Synthetic Aperture Radar (InSAR). InSAR is a cutting-edge method that involves using radar images taken from satellites to detect and measure the Earth’s surface changes, down to millimeters. This was crucial for understanding the extent and rate of land subsidence along the East Coast.
The researchers analyzed a vast dataset of radar images, spanning from 2007 to 2020, taken from Sentinel-1 A/B and ALOS-1 satellites. They meticulously processed these images using a technique called WabInSAR (Wavelet-Based InSAR), which helps in reducing noise and atmospheric disturbances, ensuring more precise and reliable measurements. To further validate their findings, the team compared the InSAR data with ground-based measurements from Global Navigation Satellite System (GNSS) stations.
The publicly available satellite imagery allowed study authors to measure millions of occurrences of land subsidence over multiple years, leading to some of the world’s first high-resolution depictions of this phenomenon. To assess the subsidence’s impact on infrastructure, the study incorporated various types of data, including population density, location and condition of roads, bridges, airports, and other critical facilities. This comprehensive approach allowed the researchers to estimate the extent of exposure to subsidence hazards for different regions and infrastructure types.
“Continuous unmitigated subsidence on the U.S. East Coast should cause concern, particularly in areas with a high population and property density and a historical complacency toward infrastructure maintenance,” Ohenhen concludes.
The study is published in the Proceedings of the National Academies of Sciences.


