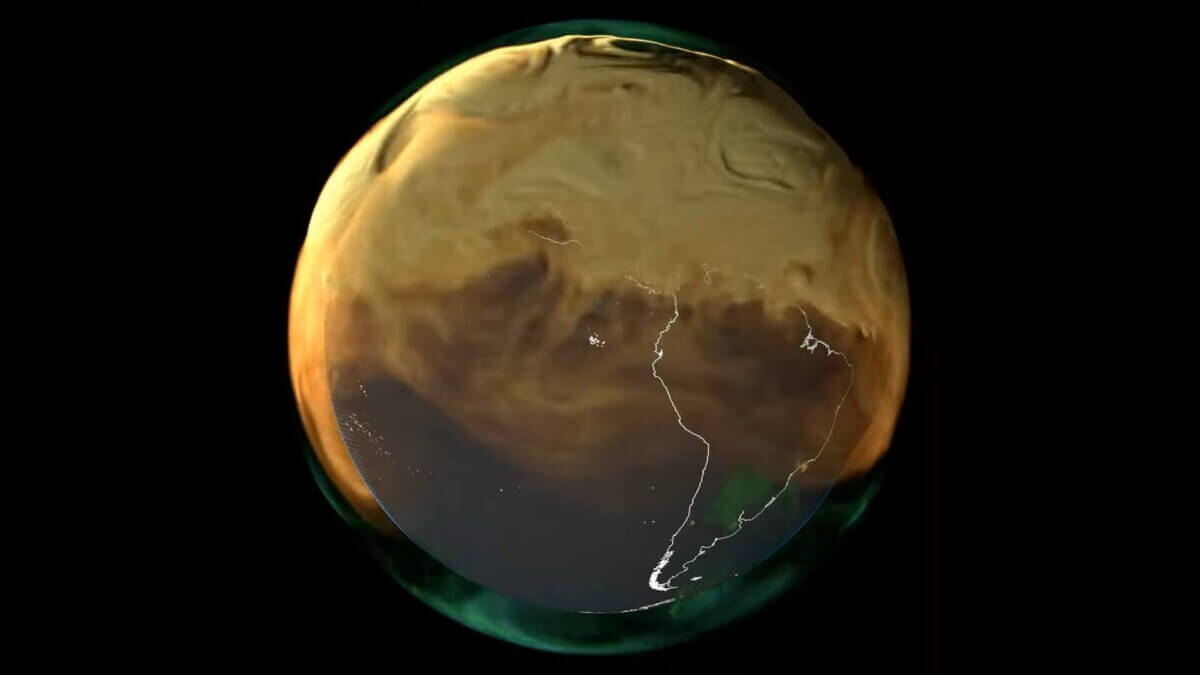
Carbon dioxide is by far the most prevalent greenhouse gas contributing to climate change - but where does it come from? New computer modeling techniques in NASA's Global Modeling and Assimilation Office allow us to dissect our atmosphere and understand some of the major contributors to this runaway insulator. (Credit: NASA)
WASHINGTON — Unlike the orange skies and toxic air coming from the Canadian wildfires, carbon emissions are not something everyone can see floating around each day. However, NASA is changing all that, using high-tech visual models to reveal all of the invisible greenhouse gases swirling around the globe each year.
Countless studies have detailed how human activity has contributed to the record increase of carbon dioxide in our atmosphere. This keeps heat from radiating out into space and naturally cooling Earth. As more greenhouse gases shield heat from leaving the planet, our world gets hotter — a condition commonly referred to as global warming.
Although they’re invisible to the naked eye, NASA’s Scientific Visualization Studio is putting a face on these harmful emissions. Their simulations reveal where the majority of greenhouse gases are released and how they move around the globe over the course of a single year.
The NASA team broke down this thick soup, which covers global CO2 emissions throughout 2021. Fossil fuels are represented in orange. Burning biomass is in red, with green representing land ecosystems and blue denoting the ocean. The blue dots on the map show where carbon is mostly absorbed by ocean waters, while the green dots represent producers on land.
Over North America and South America, the videos show that a major pollution hotspot is in the northeastern United States. Meanwhile, the fast oscillation over the Amazon rainforest is a result of plants absorbing carbon while the Sun shines, allowing it to build up overnight.
“This view highlights what is happening over Europe, the Middle East, and Africa. Some interesting features include a the relatively high fossil fuel emissions coming from Europe and Saudi Arabia, and also the cloud of red agricultural burn emissions coming from central Africa,” the NASA team explains in a media release.
Over Asia and Australia, researchers discovered a major pollution hotspot near Beijing, China. There was also a relative lack of fossil fuel emissions around the continent of Australia, where there is a low population density.
Climate change could lead to record-setting heatwaves soon
Recently, researchers from the University of Bristol identified regions all over the world that are most vulnerable to the devastating effects of these scorching temperatures.
Researchers explain that these unprecedented heat extremes, in combination with various local socioeconomic vulnerabilities, put certain regions in particular peril. Examples include Afghanistan, Papua New Guinea, and Central America.
Study authors also point to Beijing and Central Europe as potential hotspots. If record-breaking heatwaves were to occur in such densely populated regions, it would adversely affect millions of people. All in all, researchers are calling for policy makers in so-called hotspot regions to consider and implement relevant action plans that will reduce the risk of deaths and any associated harms from climate extremes.
Global warming may be making air travel extremely bumpy
New research indicates that air travel has become increasingly bumpy over the past 40 years, primarily due to global warming. The study suggests that potentially catastrophic aviation turbulence has intensified as the world continued to warm between 1979 and 2020. Transatlantic flights appear to be the most at risk for turbulence, according to scientists.
Conducted by a team at the University of Reading, the research demonstrates that clear-air turbulence — an invisible yet hazardous phenomenon for aircraft — has escalated in various regions worldwide since the 1980s.
At a typical point over the North Atlantic, one of the world’s busiest air routes, the total annual duration of severe turbulence saw a notable increase of 55 percent. It went up from 17.7 hours in 1979 to 27.4 hours in 2020.


Fear-monger much?
NASA could use the same color scheme to indicate density of trees which would look similar to these images. That would also be true of imagery indicating density of food for humans.
Your single-sentence “escape clause” statement about invisibility of carbon dioxide is ludicrous. The vast majority of this post is clear anti-human-civilization and yet more agitprop.
“Greenhouse gases” regulate the temperature of the Earth. Without them, no life is possible.
Carbon Dioxide is NOT the most prevalent, nor is it the most powerful “greenhouse gas.”
Water vapor is.
Carbon dioxide and sunlight are the primary energy source for plants.
Human deaths from being cold are many times greater than those from heat.
“Global Warming” is a monetary/political scam.
The Earth has been much hotter, and much cooler, than it is now.
For that matter, the Earth is actually becoming cooler.
You beat me to it, Fred, and said it much more eloquently and with much less disgust and sarcasm than i could have.
Science is dead. Long live $$$cience.
Virtually all of your comments are straw arguments, deflections and irrelevant. In other words completely useless. You can’t even stay on topic. you pretend that these emotions don’t matter and clearly they do. This is well established by the science community. however, you choose to be in denial and spew ignorance. Your post is more about you than anything else.
Good article