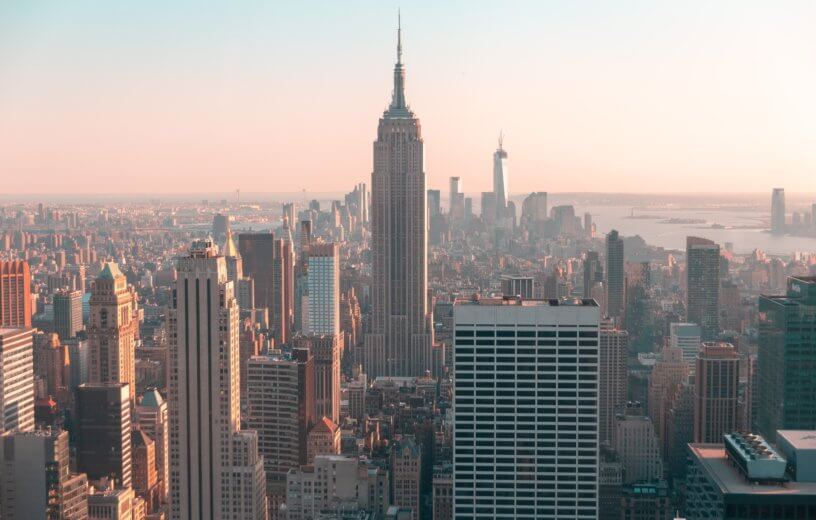
PASADENA, Calif. — New York City is slowly sinking underground. NASA researchers have come to this conclusion after space-based radar found a few spots in the metropolitan area sinking and rising at different rates.
Tracking the changes in land motion is important for preparing communities that might be more prone to flooding, researchers note.
“We’ve produced such a detailed map of vertical land motion in the New York City area that there are features popping out that haven’t been noticed before,” says Brett Buzzanga, a scientist at NASA’s Jet Propulsion Laboratory in California, in a media release.
The authors warn that the elevation changes are small — a few fractions of inches per year. However, even just a few inches can make flooding more devastating and damaging to the community, especially as sea levels continue to rise because of climate change.
The team used a remote sensing technique called the interferometric synthetic aperture radar (InSAR) to study land motion shifts up and down from 2016 to 2023. The technique uses two or more 3D observations of the same region to look at surface motion.
Results show changes to land motion in the Big Apple were caused by humans through land reclamation (restoring damaged land to its previous condition) and the construction of landfills. This manipulation of the Earth’s surface caused the ground to loosen and compress underneath the building constructed on top of it.
Humans are not the only culprits
Some of the motion is related to the last ice age about 24,000 years ago. During this time, a huge ice sheet covered most of the New England area. Additionally, a wall of ice more than a mile high covered present-day Albany in upstate New York. This immense amount of ice caused great pressure on the ground. Scientists liken Earth’s mantle to a flexed mattress that has been trying to adjust to the changes since then. New York City was built on land that was just outside the edge of the ice sheet and is now sinking back down.
On average, the authors estimate New York City sinks about 0.06 inches per year. This is about the same amount it takes for a toenail to grow in a month. Two particular spots in the borough of Queens stood out the most in mapping data.
The first hotspot is runway 13/31 at LaGuardia Airport which is sinking at an estimated rate of 0.15 inches per year. Ironically, this area coincides with an $8 billion renovation designed to stop flooding from rising waters in the Atlantic Ocean.
The second area sinking the fastest is Arthur Ashe Stadium. It is sinking at a rate of 0.18 inches a year. This is also the location where there was construction for a lightweight roof during its renovation.
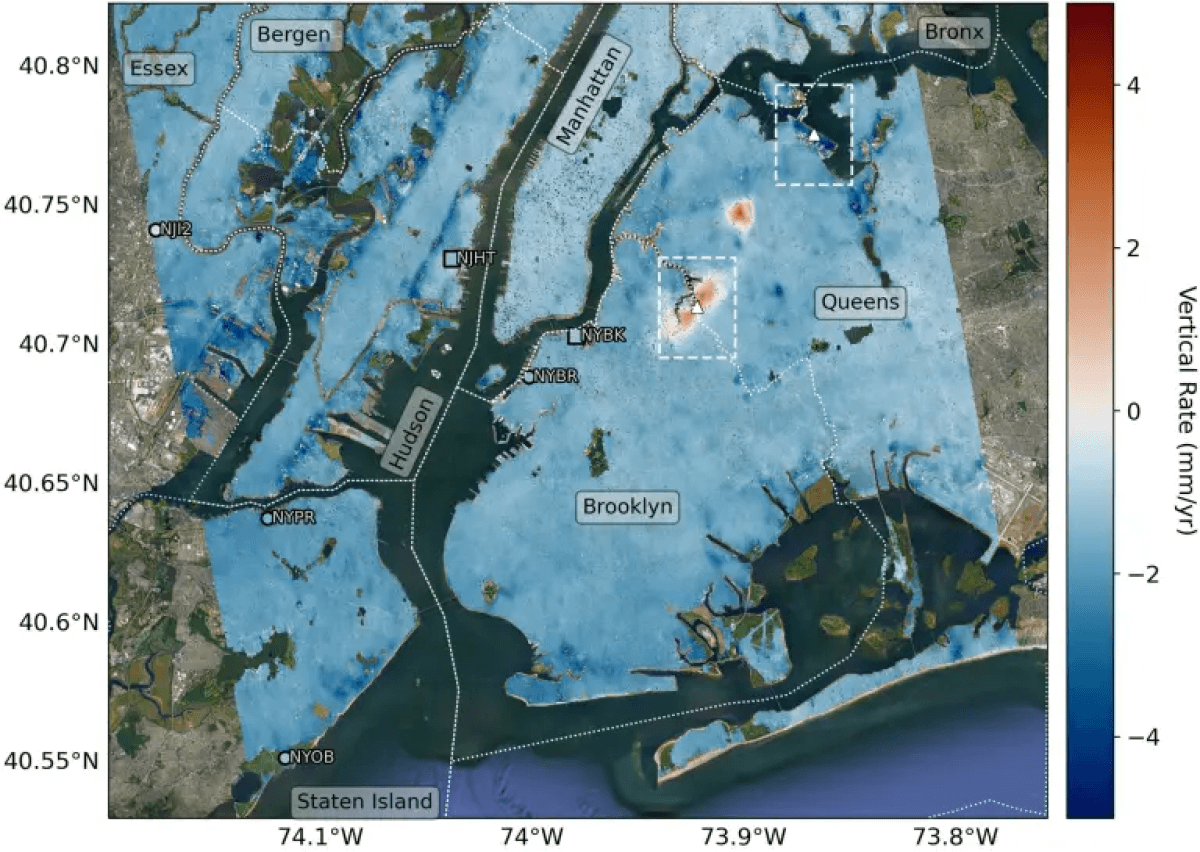
While sinking at a lesser rate, other areas of New York City have seen changes in land motion. This includes the southern portion of Governors Islands, which was built on 38 million square feet of rocks and dirt from early 20th-century subway excavations. Moreover, sites near the ocean in Brooklyn’s Coney Island and Arverne by the Sea in Queens are also sinking. Both are built on artificial fill. Near New Jersey, two sinking areas are beneath Route 440 and Interstate 78. Rikers Island has also seen changes likely due to its expansion in size from landfilling.
Interestingly, some parts of New York City are not sinking but rising higher. Scientists noticed a 0.06-inch rise per year in East Williamsburg, Brooklyn. Woodside, Queens also had a 0.27 uplift per year between 2016 and 2019 before stabilizing. While the answer to this change in land motion is not entirely clear, one theory is that groundwater pumping and injection wells used to treat polluted water may have something to do with it.
“I’m intrigued by the potential of using high-resolution InSAR to measure these kinds of relatively short-lived environmental modifications associated with uplift,” says Robert Kopp, a researcher at Rutgers University and co-author of the study.
The study is published in the journal Science Advances.
You might also be interested in:
- ‘Significant’ sinking ground discovered in Houston suburbs
- U.S. subway systems filled with hazardous air pollutants, but New York City ranks worst of all
- $4,000 for rent in New York? See the amazing homes that money buys in 9 states